. 2017 Sep 5;18(1):166.
doi: 10.1186/s13059-017-1301-4.

Protein recoding by ADAR1-mediated RNA editing is not essential for normal development and homeostasis

Affiliations

Protein recoding by ADAR1-mediated RNA editing is not essential for normal development and homeostasis

Jacki E Heraud-Farlow et al. Genome Biol. .

Abstract

Background: Adenosine-to-inosine (A-to-I) editing of dsRNA by ADAR proteins is a pervasive epitranscriptome feature. Tens of thousands of A-to-I editing events are defined in the mouse, yet the functional impact of most is unknown. Editing causing protein recoding is the essential function of ADAR2, but an essential role for recoding by ADAR1 has not been demonstrated. ADAR1 has been proposed to have editing-dependent and editing-independent functions. The relative contribution of these in vivo has not been clearly defined. A critical function of ADAR1 is editing of endogenous RNA to prevent activation of the dsRNA sensor MDA5 (Ifih1). Outside of this, how ADAR1 editing contributes to normal development and homeostasis is uncertain.

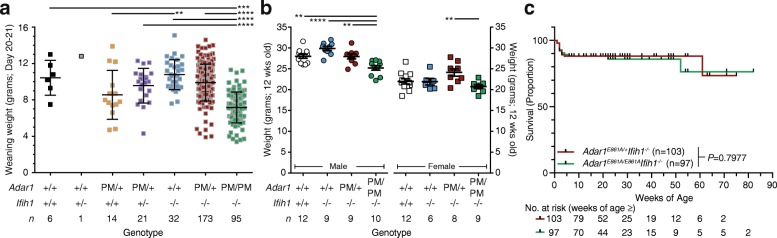
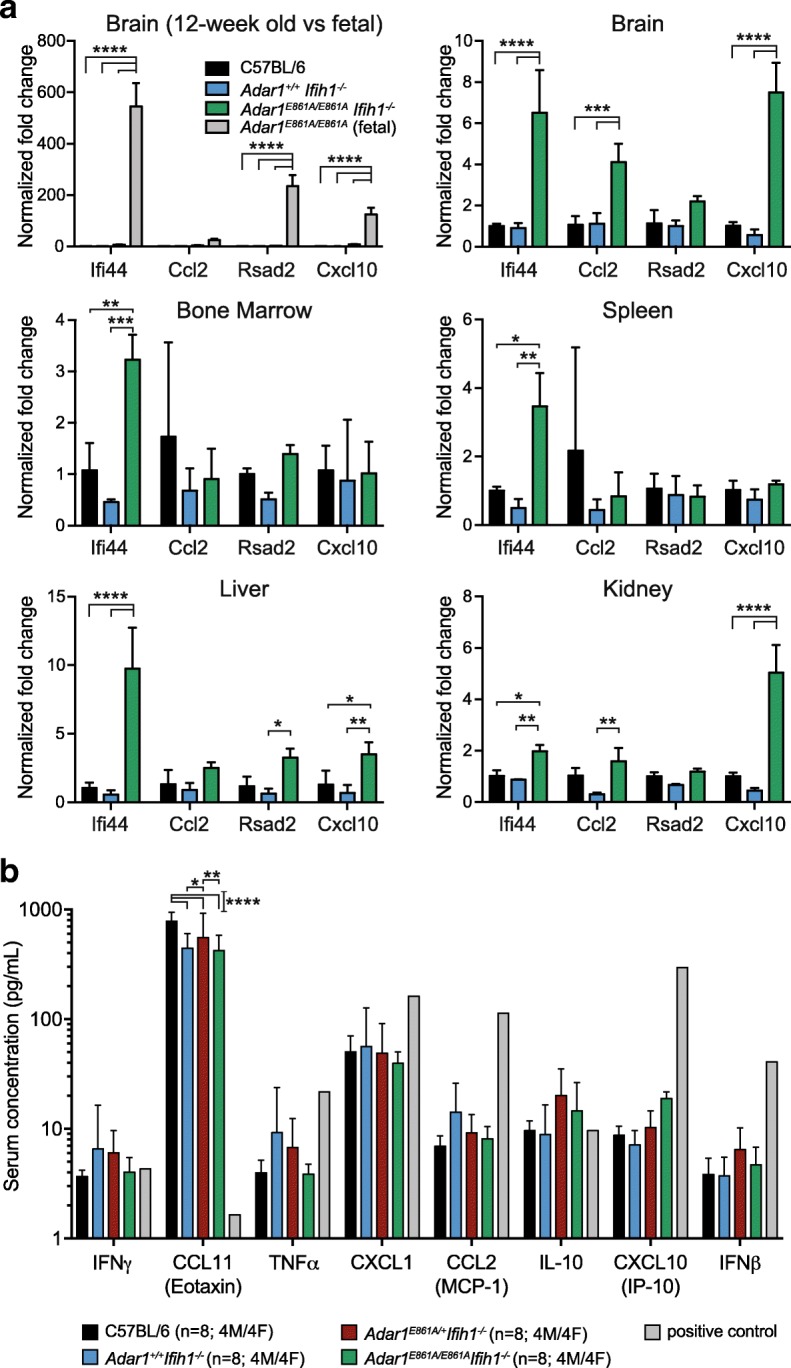
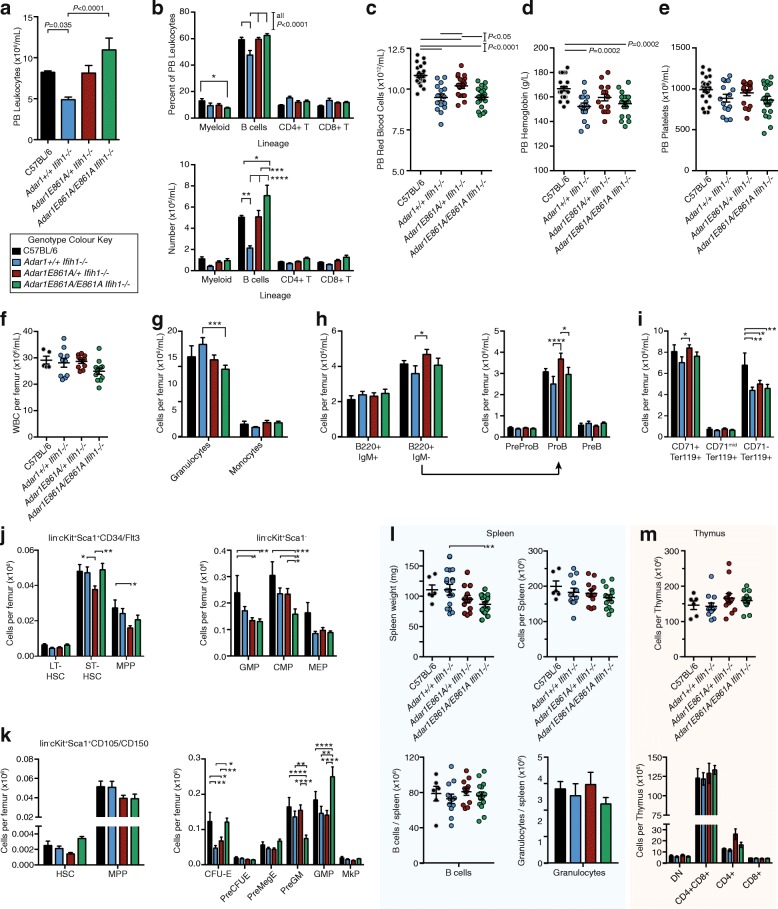
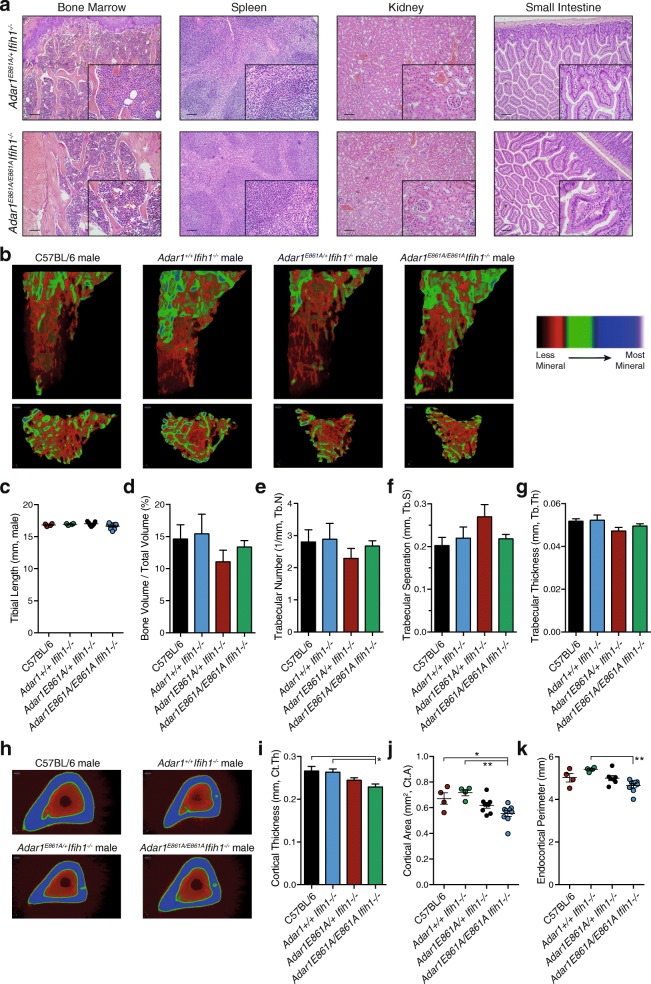
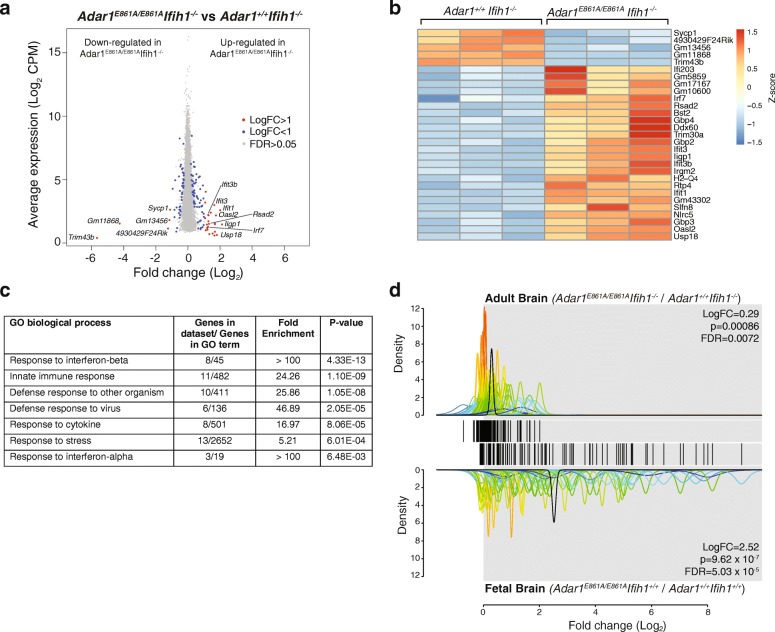
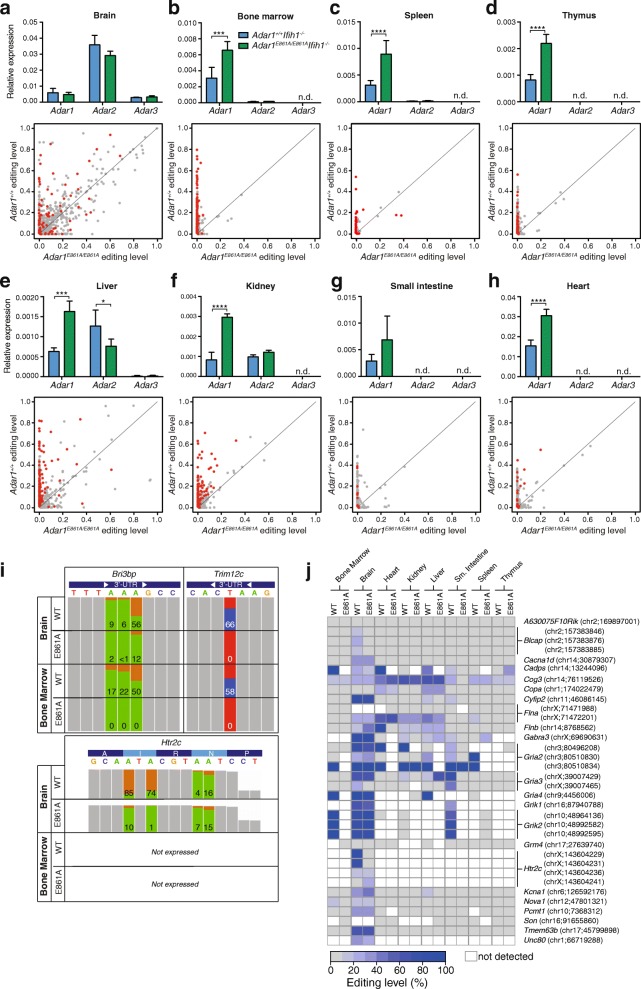
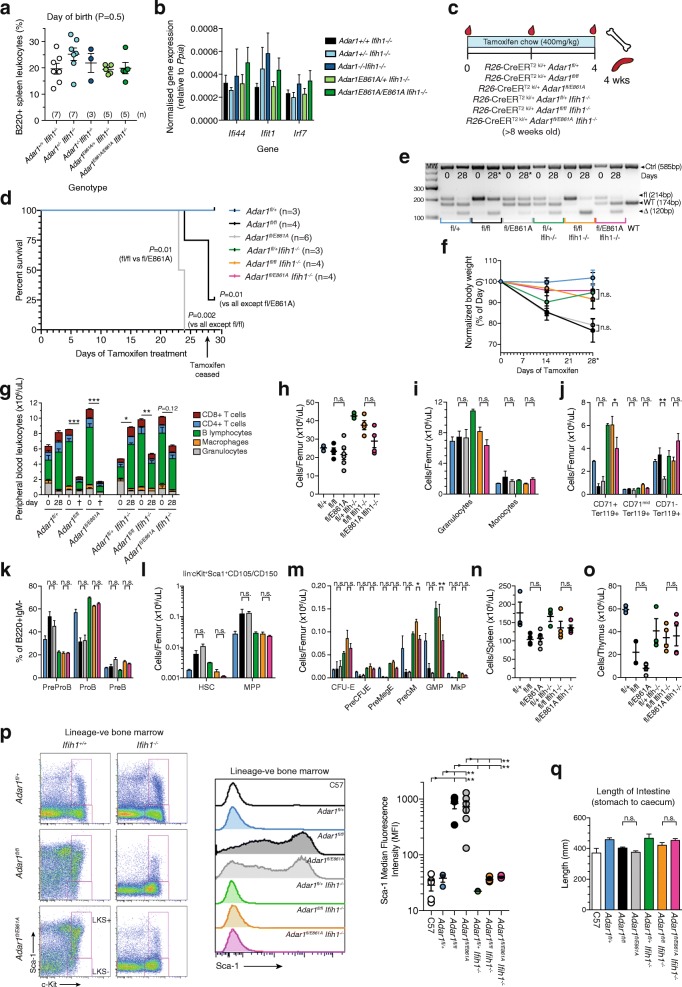
Results: We describe the consequences of ADAR1 editing deficiency on murine homeostasis. Adar1 E861A/E861A Ifih1 -/- mice are strikingly normal, including their lifespan. There is a mild, non-pathogenic innate immune activation signature in the Adar1 E861A/E861A Ifih1 -/- mice. Assessing A-to-I editing across adult tissues demonstrates that outside of the brain, ADAR1 performs the majority of editing and that ADAR2 cannot compensate in its absence. Direct comparison of the Adar1 -/- and Adar1 E861A/E861A alleles demonstrates a high degree of concordance on both Ifih1 +/+ and Ifih1 -/- backgrounds, suggesting no substantial contribution from ADAR1 editing-independent functions.

Conclusions: These analyses demonstrate that the lifetime absence of ADAR1-editing is well tolerated in the absence of MDA5. We conclude that protein recoding arising from ADAR1-mediated editing is not essential for organismal homeostasis. Additionally, the phenotypes associated with loss of ADAR1 are the result of RNA editing and MDA5-dependent functions.

Keywords: ADAR1; Development; Epitranscriptome; Innate immunity; MDA5; RNA editing; dsRNA.


Conflict of interest statement

Ethics approval and consent to participate

All animal experiments were approved by the St. Vincent’s Hospital, Melbourne Animal Ethics Committee (AEC#030/14 and AEC#031/15).

Consent for publication

Not applicable.

Competing interests

The authors declare that they have no competing interests.

Publisher’s Note

Springer Nature remains neutral with regard to jurisdictional claims in published maps and institutional affiliations.

Figures

Fig. 1
Fig. 1
Reduced weaning weight and normal survival of Adar1 E861A/E861A Ifih1 -/- animals. a Weaning weight of indicated genotypes. b Weight of 12-week-old male and female animals of indicated genotypes. c Kaplan–Meier survival plot of Adar1 E861A/+ Ifih1 -/- and Adar1 E861A/E861A Ifih1 -/-. Number of animals at risk indicates the number in the cohort/age bracket. Results are mean ± SEM with *P < 0.05, **P < 0.005, and ****P < 0.00001
Fig. 2
Fig. 2
Modest activation of ISG expression in Adar1 E861A/E861A Ifih1 -/- tissues. a Quantitative reverse transcription polymerase chain reaction (qRT-PCR) of four ISGs from tissues of 12-week-old mice, with the exception of the first panel comparing 12-week-old brain with E12.5 fetal brain from Adar1 E861A/E861A Ifih1 +/+ embryos. Data represent mean ± SEM (n = 3/genotype); all samples normalized to C57BL/6. b PB serum cytokine levels from indicated genotypes. Positive control = supernatant from tamoxifen treated R26-CreERT2 Adar1 E861A/fl hematopoietic cell line. Results are mean ± SEM; significance determined using two-way ANOVA, *P < 0.05, **P < 0.01, ***P < 0.001, ****P < 0.0001
Fig. 3
Fig. 3
Hematopoiesis and B-cell production are normal in the absence of ADAR1 editing. PB, BM, spleen, and thymus analyzed of 12-week-old mice. ae PB analysis from C57BL/6 (n = 25), Adar1 +/+ Ifih1 -/- (n = 15), Adar1 E861A/+ Ifih1 -/- (n = 17), Adar1 E861A/E861A Ifih1 -/- (n = 19) indicating (a) total leukocyte counts, (b) % and absolute number of each leukocyte subtype, (c) red blood cell counts, (d) hemoglobin levels, and (e) platelet numbers. fj BM analysis of C57BL/6 (n = 5), Adar1 +/+ Ifih1 -/- (n = 10), Adar1 E861A/+ Ifih1 -/- (n = 11), Adar1 E861A/E861A Ifih1 -/- (n = 11) showing (f) total leukocyte counts per femur, (g) numbers of granulocytes and monocytes, (h) mature (B220 + IgM+) and immature (B220 + IgM-) B-cell populations and subsets of the immature populations as indicated, (i) erythroid cells; and jk hematopoietic stem and progenitor populations using two methods. (l) Spleen weight and cellularity, B cells and granulocyte numbers per spleen from C57BL/6 (n = 6), Adar1 +/+ Ifih1 -/- (n = 12), Adar1 E861A/+ Ifih1 -/- (n = 12), Adar1 E861A/E861A Ifih1 -/- (n = 14). (m) Thymic cellularity and CD4/CD8 composition in C57BL/6 (n = 6), Adar1 +/+ Ifih1 -/- (n = 12), Adar1 E861A/+ Ifih1 -/- (n = 12), Adar1 E861A/E861A Ifih1 -/- (n = 13). Results are mean ± SEM; data shown are pooled from at least three independent experiments; significance determined using two-way ANOVA with correction for multiple comparisons; *P < 0.05, **P < 0.01, ***P < 0.001, ****P < 0.0001
Fig. 4
Fig. 4
Normal organ histology in the absence of ADAR1 RNA editing. a Hematoxylin and eosin (H&E)-stained sections of the indicated organs of Adar1 E861A/E861A Ifih1 -/- (n = 4; 2 male, 2 female) and Adar1 E861A/+ Ifih1 -/- (n = 4; 2 male, 2 female) control littermates. 10× magnification with 100-μM scale bar; 40× inset for each. bg MicroCT analysis of tibial bone; C57BL/6 (n = 4), Adar1 +/+ Ifih1 -/- (n = 4), Adar1 E861A/+ Ifih1 -/- (n = 7), Adar1 E861A/E861A Ifih1 -/- (n = 9). b Representative images of reconstructed trabecular region of the secondary spongiosa within the proximal tibia with color-coded quantitative mineralization from indicated genotypes. c Tibial length, (d) Trabecular bone volume, (e) trabecular number, (f) trabecular separation, and (g) trabecular thickness. hk MicroCT analysis of cortical bone of the same samples used for panels (bg). h Representative images of reconstructed cortical bone with color-coded quantitative mineralization, (i) cortical thickness, (j) cortical bone area, and (k) endocortical perimeter. Results are mean ± SEM; significance tested using ANOVA, *P < 0.05, **P < 0.01
Fig. 5
Fig. 5
The absence of ADAR1-mediated editing has minimal effect on gene expression in the adult brain. RNA-sequencing (RNA-seq) analysis of 12-week-old mouse brains (n = 3 biological replicates/genotype). a MA plot for differentially expressed genes. All genes expressed in brain with CPM ≥ 2 in all replicates/genotype indicated by a dot. b Heatmap of differentially expressed genes with a log2FC ≥ 1 in three biological replicates/genotype. Colors reflect the z-score. c Enriched pathways by GO term within differentially expressed genes (false discovery rate [FDR] ≤ 0.05, log2FC ≥ 1, n = 29 genes). d QuSAGE analysis using the Adar1 E861A/E861A fetal liver gene signature as the gene set. Each gene is depicted by a single line within the barcode. Adult brain from Adar1 E861A/E861A Ifih1 -/- mice and fetal brain from Adar1 E861A/E861A mice (relative to respective controls; n = 3 biological replicates/genotype) were compared against the Adar1 E861A/E861A gene set. Curves represent the standard deviation between biological replicates for each gene and are color-coded by the magnitude of deviation. The black curve in each panel represents the average log2FC for all genes in the set in each dataset
Fig. 6
Fig. 6
ADAR1 is the predominant ADAR in peripheral tissues and affects editing levels across all tissues. ah Upper panels: qRT-PCR of Adar expression from tissues of 12-week-old mice. Data normalized to Ppia and are the mean ± SEM (n = 3/genotype). n.d not detected. Lower panels: Editing of known sites measured using multiplexed PCR and deep sequencing (mmPCR-seq) in each tissue. Editing levels in Adar1 +/+ Ifih1 -/- (ADAR1 WT; y-axis) plotted against those in the Adar1 E861A/E861A Ifih1 -/- (ADAR1 editing deficient; x-axis) with each individual site indicated by a dot. Gray dot = no significant difference, red dot = P < 0.05. i Examples of editing at three loci. Colored panels indicate the edited nucleotides ((+) strand: green = A, orange = G; (-) strand: red = T(A), blue = C(G)). Bri3bp is a representative shared Adar1 and Adar2 target at the third adenosine; Trim12c is representative of an ADAR1-specific target. Htr2c is representative of an ADAR1-specific recoding event at the first two sites. Percent editing is indicated for each site. j Analysis of conserved editing sites in each tissue by mmPCR-seq. Editing sites were compared between Adar1 +/+ Ifih1 -/- (ADAR1 WT) and Adar1 E861A/E861A Ifih1 -/- tissues as indicated. White indicates no expression/reads detected in the tissue. Data include all sites with > 100 reads in the mmPCR-seq
Fig. 7
Fig. 7
The complete absence of ADAR1 and the specific loss of ADAR1-mediated editing activity phenocopy. a Percentage of B cells (B220 + ve) spleen leukocytes in the indicated genotypes at the day of birth, n as indicated in (a). Data are pooled from at least two separate litters per genotype. b Expression of Ifi44, Ifit1, and Irf7 transcript in whole brain from the indicated genotypes on the day of birth, n as for (a). c Experimental outline of somatic deletion model; all mice were aged ≥ 8 weeks at tamoxifen initiation (defined as day 0). d Kaplan–Meier survival plot of each genotype. All Ifih1 -/- lines fall under the Adar1 fl/+. Mice were analyzed on the day of euthanasia or day 29 as indicated. e Genotyping of genomic DNA at day 0 (PB-derived cells) and day 28/euthanasia (BM-derived cells) for each genotype. f Change in body weight (day 0 normalized to 100%) and day 28/euthanasia. g PB leukocyte counts and lineage distribution within the total leukocyte count at day 0 (pre-tamoxifen) and day of euthanasia or day 28 as indicated in (b). Statistics compare day 0 and day of euthanasia/day 28 within an individual genotype. h BM cellularity, (i) granulocytes and macrophages, (j) erythroid cells, (k) percentages of B cell precursors within the B220 + IgM- population, (l) stem cell and multipotent progenitor populations, (m) the numbers of myelo-erythroid progenitors/femur for each genotype. n Spleen and (o) thymus cellularity. p Representative FACS plots of Sca-1 expression in the lin-c-Kit+ BM fraction. Representative median fluorescence intensity histogram plots of Sca1 and quantitation of Sca1 expression levels. q Intestine length (stomach – caecum) for each genotype at day of euthanasia or day 29 as indicated in (b). Statistical comparison (except (b, d)) shown only for R26-CreERki/+ Adar1 fl/fl vs. R26-CreERki/+ Adar1 fl/E861A and R26-CreERki/+ Adar1 fl/fl Ifih1 -/- vs. R26-CreERki/+ Adar1 fl/E861A Ifih1 -/-. Full statistical analysis of all comparisons in Additional file 6: Table S1. Number of animals per group indicated in (b); data are pooled from two separate experiments. *P < 0.05; **P < 0.01, ***P < 0.001

References

    1. Gilbert WV, Bell TA, Schaening C. Messenger RNA modifications: Form, distribution, and function. Science. 2016;352:1408–12. doi: 10.1126/science.aad8711. - DOI - PMC - PubMed
    1. O’Connell MA, Mannion NM, Keegan LP. The epitranscriptome and innate immunity. PLoS Genet. 2015;11:e1005687. doi: 10.1371/journal.pgen.1005687. - DOI - PMC - PubMed
    1. Bazak L, Haviv A, Barak M, Jacob-Hirsch J, Deng P, Zhang R, et al. A-to-I RNA editing occurs at over a hundred million genomic sites, located in a majority of human genes. Genome Res. 2014;24:365–76. doi: 10.1101/gr.164749.113. - DOI - PMC - PubMed
    1. Ramaswami G, Li JB. RADAR: a rigorously annotated database of A-to-I RNA editing. Nucleic Acids Res. 2014;42:D109–113. doi: 10.1093/nar/gkt996. - DOI - PMC - PubMed
    1. Hundley HA, Bass BL. ADAR editing in double-stranded UTRs and other noncoding RNA sequences. Trends Biochem Sci. 2010;35:377–83. doi: 10.1016/j.tibs.2010.02.008. - DOI - PMC - PubMed

Publication types