. 2017 Oct 24;61(11):e01368-17.
doi: 10.1128/AAC.01368-17. Print 2017 Nov.

Evaluation of the Innate Immune Modulator Acitretin as a Strategy To Clear the HIV Reservoir

Affiliations

Evaluation of the Innate Immune Modulator Acitretin as a Strategy To Clear the HIV Reservoir

Edurne Garcia-Vidal et al. Antimicrob Agents Chemother. .

Abstract

The persistence of HIV despite suppressive antiretroviral therapy is a major roadblock to HIV eradication. Current strategies focused on inducing the expression of latent HIV fail to clear the persistent reservoir, prompting the development of new approaches for killing HIV-positive cells. Recently, acitretin was proposed as a pharmacological enhancer of the innate cellular defense network that led to virus reactivation and preferential death of infected cells. We evaluated the capacity of acitretin to reactivate and/or to facilitate immune-mediated clearance of HIV-positive cells. Acitretin did not induce HIV reactivation in latently infected cell lines (J-Lat and ACH-2). We could observe only modest induction of HIV reactivation by acitretin in latently green fluorescent protein-HIV-infected Jurkat cells, comparable to suboptimal concentrations of vorinostat, a known latency-reversing agent (LRA). Acitretin induction was insignificant, however, compared to optimal concentrations of LRAs. Acitretin failed to reactivate HIV in a model of latently infected primary CD4+ T cells but induced retinoic acid-inducible gene I (RIG-I) and mitochondrial antiviral signaling (MAVS) expression in infected and uninfected cells, confirming the role of acitretin as an innate immune modulator. However, this effect was not associated with selective killing of HIV-positive cells. In conclusion, acitretin-mediated stimulation of the RIG-I pathway for HIV reactivation is modest and thus may not meaningfully affect the HIV reservoir. Stimulation of the RIG-I-dependent interferon (IFN) cascade by acitretin may not significantly affect the selective destruction of latently infected HIV-positive cells.

Keywords: HIV-1; RIG-I; cell death; interferons; latency; reactivation.


Figures

FIG 1
FIG 1
Acitretin does not induce HIV reactivation in J-Lat and ACH-2 cells. (A and B) HIV reactivation induced by the retinoic acid derivative acitretin (ACI) (1 to 25 μM) in J-Lat clone 8.4 (A) and clone 9.2 (B) cells. The HDAC inhibitors panobinostat (PNB) (0.16 μM) and vorinostat (VOR) (0.16 to 4 μM) were used as controls. Reactivation was determined by the quantification of GFP-positive cells after culturing of J-Lat cells with HDAC inhibitors and acitretin for 24 h. (C and D) HIV reactivation induced by acitretin and HDAC inhibitors in ACH-2 cells. Reactivation was determined after 48 h of incubation by quantification of CAp24 (C) and HIV RNA copy number (D) in the supernatant. Values represent means ± SDs of at least three independent experiments performed in triplicate. UN, untreated. *, P < 0.05; **, P < 0.01; ***, P < 0.001.
FIG 2
FIG 2
Acitretin effects as a HIV reactivator in latently infected Jurkat cells and primary naive CD4+ T lymphocytes. (A) HIV reactivation induced by acitretin (ACI) (1 to 25 μM) in latently HIV-infected Jurkat (J-Hig) cells. Panobinostat (PNB) (0.16 μM) and vorinostat (VOR) (0.16 to 4 μM) were used as controls. After 24 h, reactivation was quantified as GFP-positive cells in the nonapoptotic population, measured with an anti-annexin V antibody. (B) HIV reactivation induced by acitretin and the HDAC inhibitors in latently infected primary CD4+ T cells. Naive CD4+ T cells were activated for 7 days, followed by VSV-NL43-GFP infection. After 3 days, GFP-negative cells were sorted and incubated with acitretin for 12 h. Panobinostat (0.16 μM) and vorinostat (0.16 to 4 μM) were used as controls. (C) Acitretin activity as a retinoic acid derivative in activated PBMCs. Integrin α4 and β7 expression induced by acitretin was assessed in PBMCs activated with IL-2, anti-CD3, and anti-CD28 for 7 days, followed by 72 h of incubation with IL-2 in the presence or absence of acitretin (25 μM). Integrin overexpression was measured by flow cytometry. Values represent means ± SDs of at least three independent experiments performed in triplicate. UN, untreated. *, P < 0.05; **, P < 0.01; ***, P < 0.001.
FIG 3
FIG 3
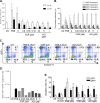
Acitretin does not selectively kill HIV-reactivated cells. (A) Apoptosis percentages in HIV-reactivated (GFP-positive) and not reactivated (GFP-negative) latently infected Jurkat cells (J-Hig). Cells were incubated for 24 h with acitretin (ACI) (1 to 25 μM), panobinostat (PNB) (0.16 μM), or vorinostat (VOR) (0.16 to 4 μM). Apoptosis percentages shown represent fractions of the total GFP-positive/negative subpopulation. Cells were evaluated by flow cytometry with double staining for HIV reactivation (GFP positive) and cell apoptosis (annexin V positive). (B) Cell distribution of apoptotic and/or HIV-reactivated J-Hig cells from the results shown in panel A, without taking into account the fraction of GFP-positive or GFP-negative cells. Assays were evaluated by flow cytometry. (C) Representative cytometry plots from the data in panel A, showing the four subpopulations, i.e., GFP-positive/annexin V-positive, GFP-positive/annexin V-negative, GFP-negative/annexin V-positive, and GFP-negative/annexin V-negative. (D) Ratio of apoptosis values for the HIV-reactivated (GFP-positive) population and the nonreactivated (GFP-negative) population in J-Hig cells. A drug that is selective against HIV-reactivated cells is expected to have a value of >1. (E) Apoptosis percentages in HIV-reactivated (GFP-positive) and nonreactivated (GFP-negative) latently infected primary CD4+ T cells. Cells were incubated for 12 h with acitretin, panobinostat, or vorinostat. The anti-CD3/anti-CD28 condition was used as a reactivation control. Apoptosis percentages shown represent fractions of the total GFP-positive/negative subpopulation. Values represent means ± SDs of at least three independent experiments performed in triplicate. UN, untreated.
FIG 4
FIG 4
Effects of acitretin versus panobinostat and vorinostat in different cell lines. (A) Representative immunoblot (left) and graphs representing quantification of band density (right) for TZM-bl cells with expression of RIG-I, MAVS, pIRF3, total IRF3, cleaved PARP, and Hsp90 under uninfected or NL4-3-infected conditions, after 48 h of treatment with AZT (1 μg/ml), acitretin (ACI) (1 μM), panobinostat (PAN or PNB) (0.5 μM), or vorinostat (VOR) (0.35 μM). Data were calculated relative to untreated controls in at least three independent experiments. Data for a representative donor are shown. (B) Representative immunoblot (left) and graph representing quantification of band density (right) for ACH-2 cells with protein expression of MDA-5, RIG-I, MAVS, total IRF3, and GAPDH, after 48 h of treatment with acitretin (25 μM or 5 μM) or vorinostat (0.35 μM). Data were calculated relative to untreated controls in at least three independent experiments. A representative experiment is shown. ND, no drug; UN, uninfected. *, P < 0.05; **, P < 0.005; ***, P < 0.0005.
FIG 5
FIG 5
Effects of acitretin versus panobinostat and vorinostat in primary cells. (A) Representative immunoblot (left) and graph representing quantification of band density (right) for monocyte-derived macrophages treated with acitretin (ACI) at 10 μM or 2 μM. Protein expression of RIG-I, MAVS, total IRF3, cleaved PARP, and GAPDH after 24 h of treatment is shown. Data were calculated relative to untreated controls in at least two independent experiments. Data for a representative donor are shown. (B and C) Representative immunoblots (left) and graphs representing quantification of band density (right) for resting (B) or activated (C) CD4+ T cells with protein expression of MDA-5, RIG-I, MAVS, total IRF3, cleaved PARP, and GAPDH, under uninfected or infected conditions, after 48 h of treatment with acitretin (5 μM) or vorinostat (VOR) (0.35 μM). Data were calculated relative to untreated controls in at least three independent experiments. Data for a representative donor are shown. ND, no drug; UN, uninfected. *, P < 0.05; **, P < 0.005; ***, P < 0.0005.

References

    1. Broder S. 2010. The development of antiretroviral therapy and its impact on the HIV-1/AIDS pandemic. Antiviral Res 85:1–18. doi:10.1016/j.antiviral.2009.10.002. - DOI - PMC - PubMed
    1. Boritz EA, Douek DC. 2017. Perspectives on human immunodeficiency virus (HIV) cure: HIV persistence in tissue. J Infect Dis 215(Suppl 3):S128–S133. doi:10.1093/infdis/jix005. - DOI - PMC - PubMed
    1. Riley JL, Montaner LJ. 2017. Cell-mediated immunity to target the persistent human immunodeficiency virus reservoir. J Infect Dis 215(Suppl 3):S160–S171. doi:10.1093/infdis/jix002. - DOI - PMC - PubMed
    1. Andrei G, Carter K, Janeba Z, Sampath A, Schang LM, Tarbet EB, Vere Hodge RA, Bray M, Este JA. 2017. Highlights of the 30th International Conference on Antiviral Research. Antiviral Res 145:184–196. doi:10.1016/j.antiviral.2017.07.017. - DOI - PMC - PubMed
    1. Brumme ZL, Chopera DR, Brockman MA. 2012. Modulation of HIV reservoirs by host HLA: bridging the gap between vaccine and cure. Curr Opin Virol 2:599–605. doi:10.1016/j.coviro.2012.08.003. - DOI - PubMed

MeSH terms