

Transcriptome Analysis Suggests That Chromosome Introgression Fragments from Sea Island Cotton (Gossypium barbadense) Increase Fiber Strength in Upland Cotton (Gossypium hirsutum)
- PMID: 28874383
- PMCID: PMC5633395
- DOI: 10.1534/g3.117.300108
Transcriptome Analysis Suggests That Chromosome Introgression Fragments from Sea Island Cotton (Gossypium barbadense) Increase Fiber Strength in Upland Cotton (Gossypium hirsutum)
Abstract
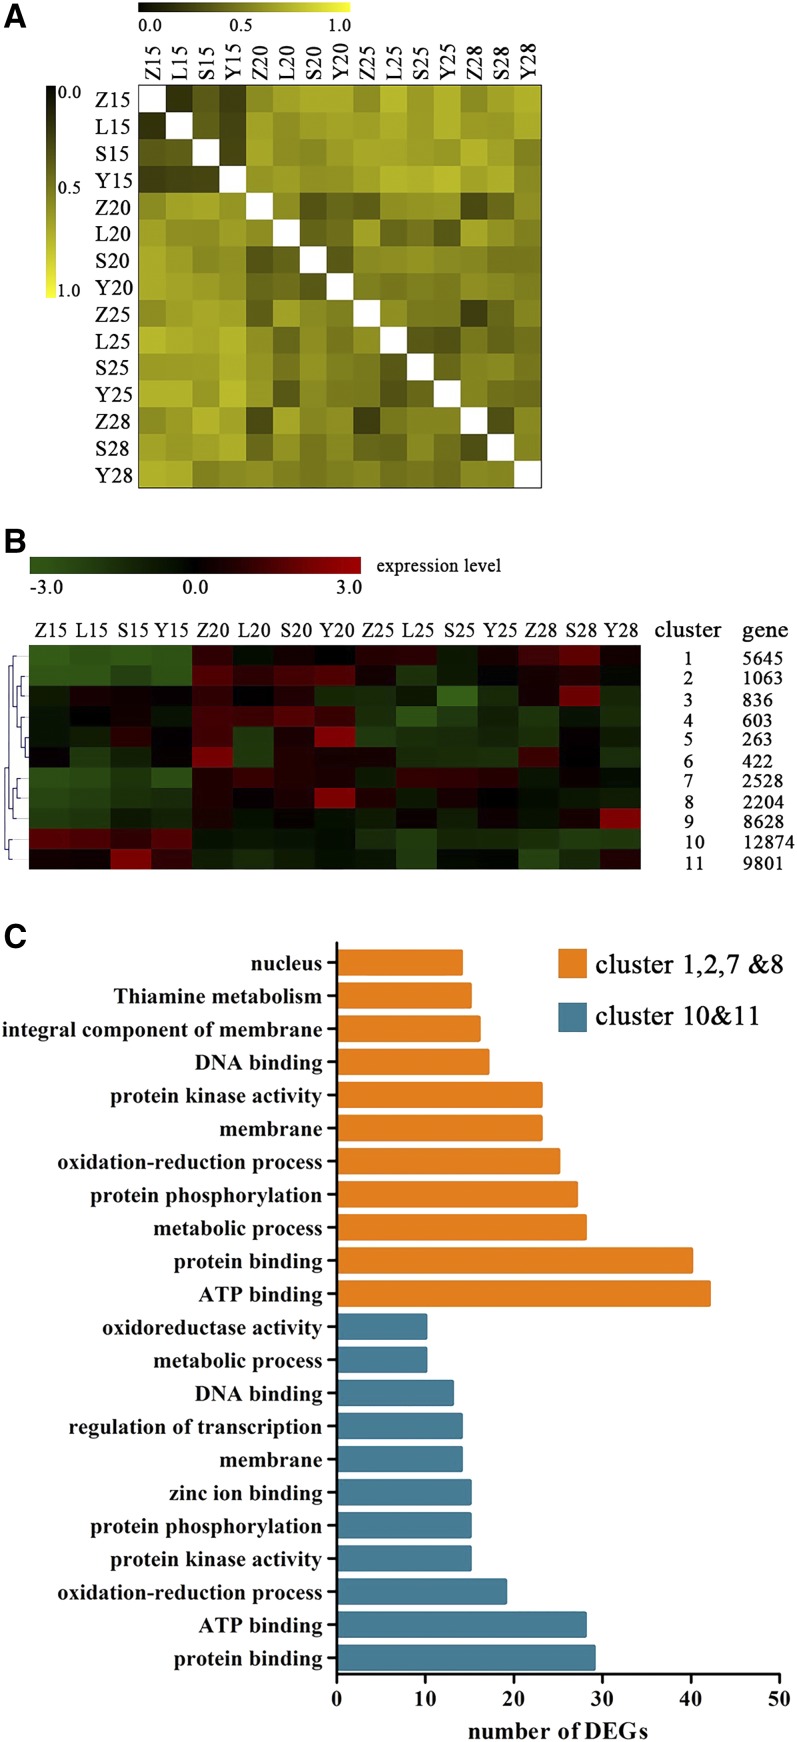
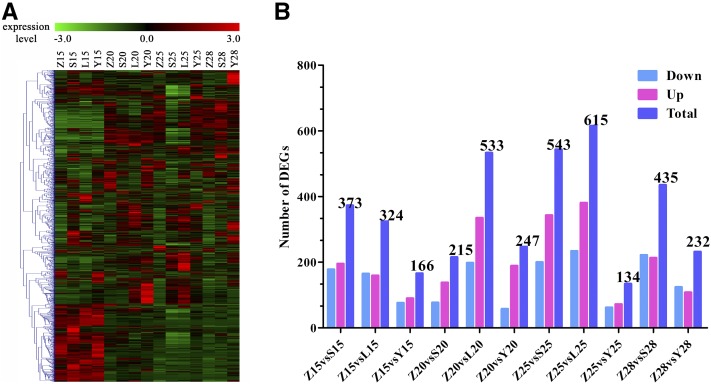
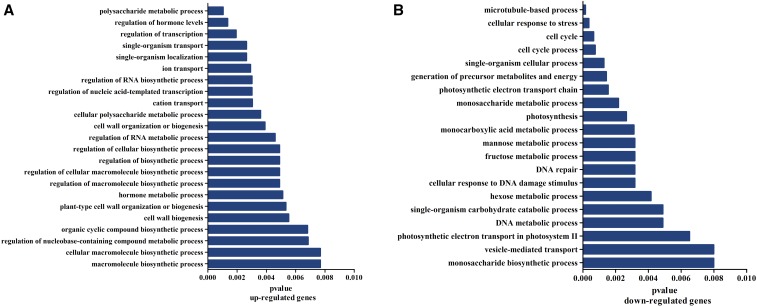
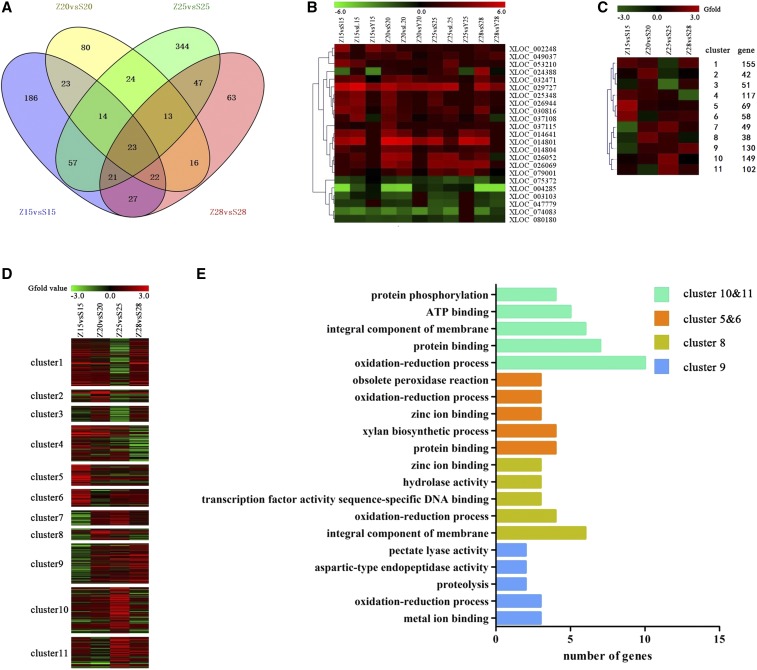
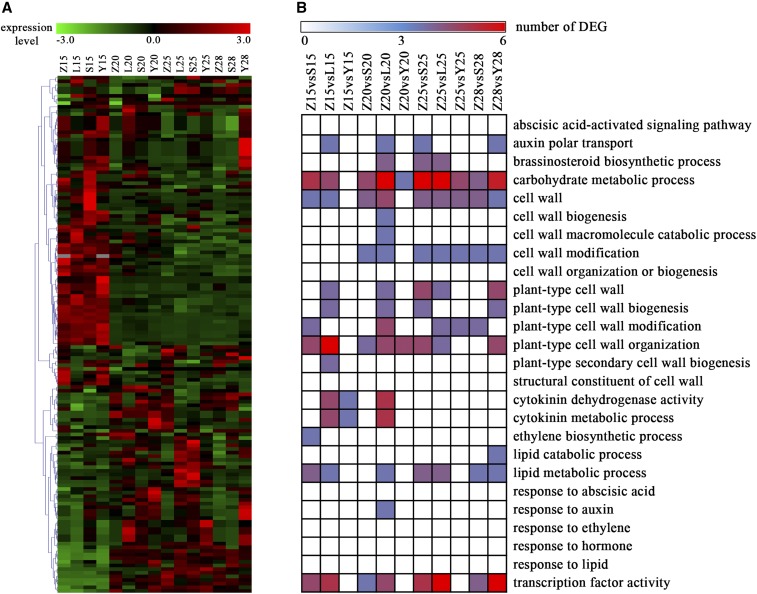
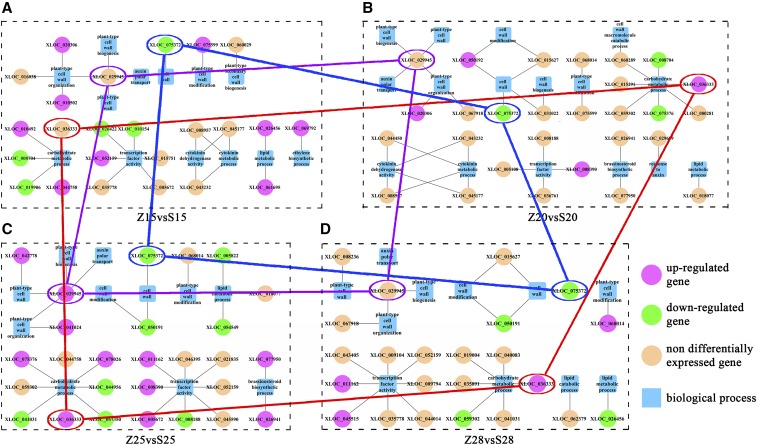
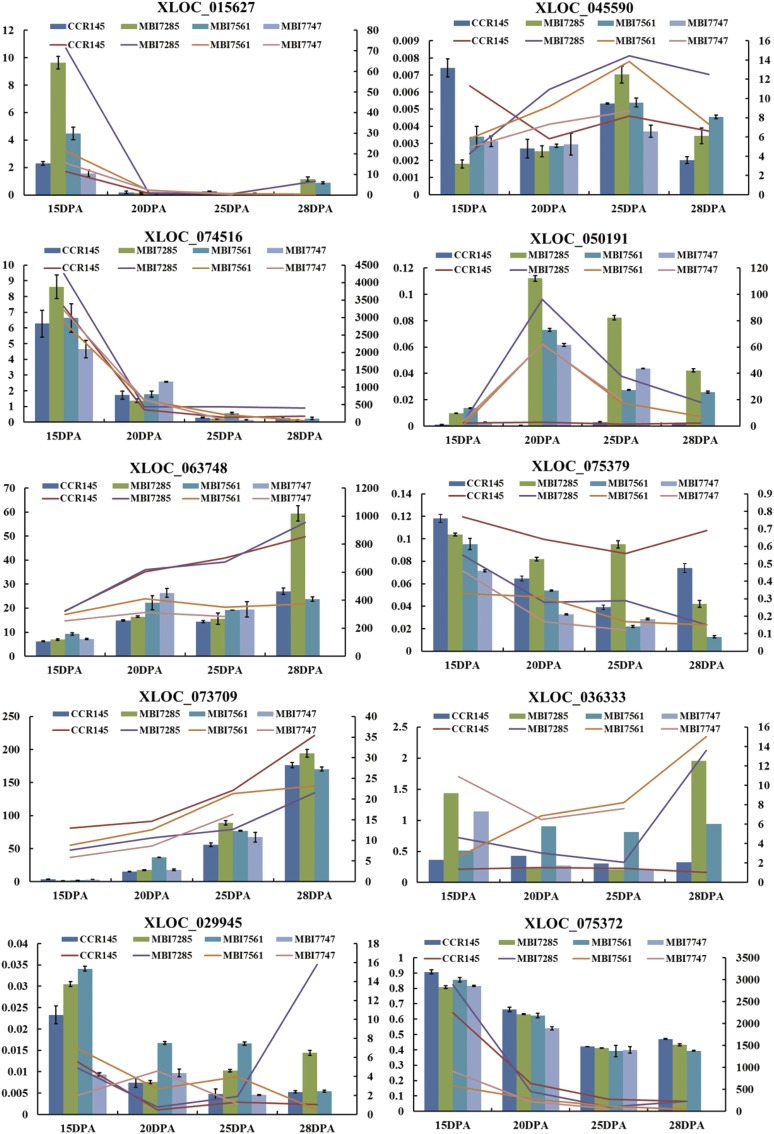
As high-strength cotton fibers are critical components of high quality cotton, developing cotton cultivars with high-strength fibers as well as high yield is a top priority for cotton development. Recently, chromosome segment substitution lines (CSSLs) have been developed from high-yield Upland cotton (Gossypium hirsutum) crossed with high-quality Sea Island cotton (G. barbadense). Here, we constructed a CSSL population by crossing CCRI45, a high-yield Upland cotton cultivar, with Hai1, a Sea Island cotton cultivar with superior fiber quality. We then selected two CSSLs with significantly higher fiber strength than CCRI45 (MBI7747 and MBI7561), and one CSSL with lower fiber strength than CCRI45 (MBI7285), for further analysis. We sequenced all four transcriptomes at four different time points postanthesis, and clustered the 44,678 identified genes by function. We identified 2200 common differentially-expressed genes (DEGs): those that were found in both high quality CSSLs (MBI7747 and MBI7561), but not in the low quality CSSL (MBI7285). Many of these genes were associated with various metabolic pathways that affect fiber strength. Upregulated DEGs were associated with polysaccharide metabolic regulation, single-organism localization, cell wall organization, and biogenesis, while the downregulated DEGs were associated with microtubule regulation, the cellular response to stress, and the cell cycle. Further analyses indicated that three genes, XLOC_036333 [mannosyl-oligosaccharide-α-mannosidase (MNS1)], XLOC_029945 (FLA8), and XLOC_075372 (snakin-1), were potentially important for the regulation of cotton fiber strength. Our results suggest that these genes may be good candidates for future investigation of the molecular mechanisms of fiber strength formation and for the improvement of cotton fiber quality through molecular breeding.
Keywords: DEG; GenPred; Genomic Selection; Shared Data Resources; cotton; fiber strength; secondary cell wall synthesis; transcriptome.
Copyright © 2017 Lu et al.
Figures
References
-
- Altschul S. F., Gish W., Miller W., Myers E. W., Lipman D. J., 1990. Basic local alignment search tool. J. Mol. Biol. 215: 403–410. - PubMed
-
- Benjamini Y., Drai D., Elmer G., Kafkafi N., Golani I., 2001. Controlling the false discovery rate in behavior genetics research. Behav. Brain Res. 125: 279–284. - PubMed
-
- Conesa A., Gotz S., Garcia-Gomez J. M., Terol J., Talon M., et al. , 2005. Blast2GO: a universal tool for annotation, visualization and analysis in functional genomics research. Bioinformatics 21: 3674–3676. - PubMed
-
- Constable G., Llewellyn D., Walford S. A., Clement J. D., 2015. Cotton breeding for fiber quality improvement, pp. 191–232 in Industrial Crops: Breeding for BioEnergy and Bioproducts, edited by Cruz V. M. V., Dierig D. A. Springer, New York.
Publication types
MeSH terms
LinkOut - more resources
Full Text Sources
Other Literature Sources
Research Materials
Miscellaneous