. 2017 Sep 19;114(38):10166-10171.
doi: 10.1073/pnas.1711125114. Epub 2017 Sep 5.

Identification of individuals by trait prediction using whole-genome sequencing data

Affiliations

Identification of individuals by trait prediction using whole-genome sequencing data

Christoph Lippert et al. Proc Natl Acad Sci U S A. .

Erratum in

Abstract

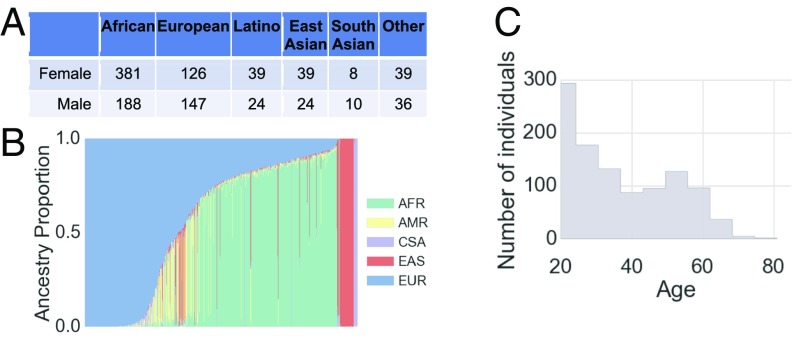
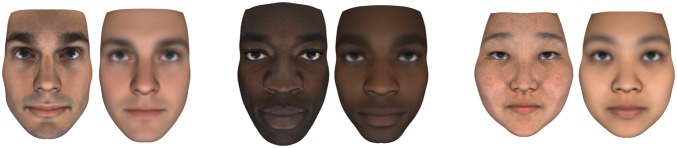
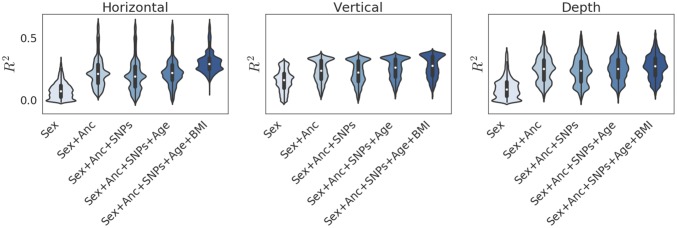
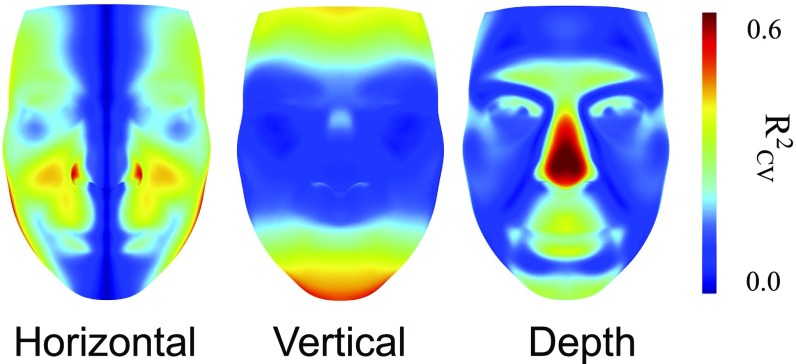
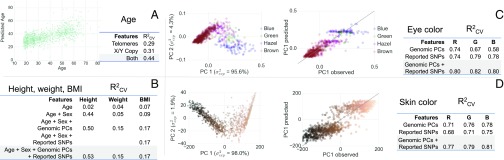
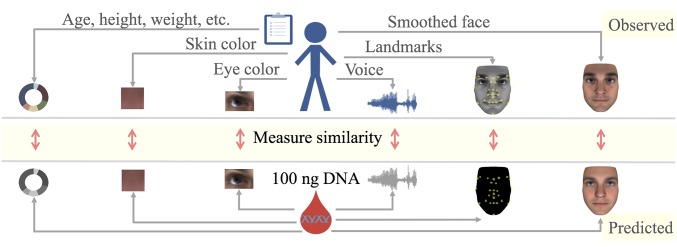
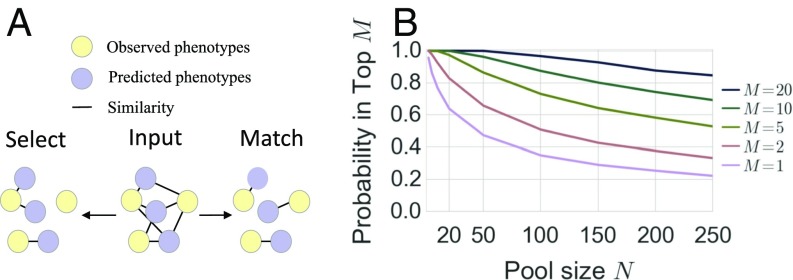
Prediction of human physical traits and demographic information from genomic data challenges privacy and data deidentification in personalized medicine. To explore the current capabilities of phenotype-based genomic identification, we applied whole-genome sequencing, detailed phenotyping, and statistical modeling to predict biometric traits in a cohort of 1,061 participants of diverse ancestry. Individually, for a large fraction of the traits, their predictive accuracy beyond ancestry and demographic information is limited. However, we have developed a maximum entropy algorithm that integrates multiple predictions to determine which genomic samples and phenotype measurements originate from the same person. Using this algorithm, we have reidentified an average of >8 of 10 held-out individuals in an ethnically mixed cohort and an average of 5 of either 10 African Americans or 10 Europeans. This work challenges current conceptions of personal privacy and may have far-reaching ethical and legal implications.

Keywords: DNA phenotyping; genome sequencing; genomic privacy; phenotype prediction; reidentification.


Conflict of interest statement

Conflict of interest statement: The authors are employees of and own equity in Human Longevity Inc.

Figures

Fig. 1.
Fig. 1.
Study overview. (A) Distribution of self-reported ethnicity in the study. (B) Inferred genomic ancestry proportions for each study participant. Ancestry components are African (AFR), Native American (AMR), Central South Asian (CSA), East Asian (EAS), and European (EUR). (C) Distribution of ages in the study.
Fig. 2.
Fig. 2.
Examples of real (Left) and predicted (Right) faces.
Fig. 3.
Fig. 3.
Violin plots of the per-pixel variation in RCV2 for face shape across three shape axes achieved for different feature sets. Anc refers to 1,000 genomic PCs. SNPs refers to previously reported SNPs related to facial structure (5, 14, 27).
Fig. 4.
Fig. 4.
Per-pixel RCV2 in face shape for the full model, across three shape axes.
Fig. 5.
Fig. 5.
(A) Predicted vs. true age. RCV2 for models using features including telomere length (telomeres) and X and Y chromosome copy numbers quantifying mosaic loss (X/Y copy). (B) Predictive performance for height, weight, and BMI using covariate sets composed from predicted age and/or sex, 1,000 genomic PCs, and previously reported SNPs. (C) Predictive performance for eye color. PC projection of observed eye color, the correlation between the first PC of observed values and the first PC of predicted values, and predictive performance of models using different covariate sets composed from three genomic PCs and previously reported SNPs are shown. (D) Predictive performance for skin color. PC projection of observed skin color, the correlation between the first PC of observed values and the first PC of predicted values, and cross-validated variance explained by models using different covariate sets composed from three genomic PCs and previously reported SNPs are shown.
Fig. 6.
Fig. 6.
Overview of the experimental approach. A DNA sample and a variety of phenotypes are collected for each individual. We used predictive modeling to derive a common embedding for phenotypes and the genomic sample as detailed in SI Appendix, Table S14. The concordance between genomic and phenotypic embeddings are used to match an individual’s phenotypic profile to the DNA sample.
Fig. 7.
Fig. 7.
Ranking individuals. (A) Schematic representation of the difference between select (best option chosen independently) and match (jointly optimal edge set chosen). Select corresponds to picking an individual out of a group of N individuals based on a genomic sample. Match corresponds to jointly matching a group of individuals to their genomes. (B) Ranking performance. The empirical probability that the true subject is ranked in the top M as a function of the pool size N.

Comment in

References

    1. Frudakis T. Molecular Photofitting: Predicting Ancestry and Phenotype Using DNA. Elsevier; New York: 2010.
    1. Liu F, et al. A genome-wide association study identifies five loci influencing facial morphology in europeans. PLoS Genet. 2012;8:e1002932. - PMC - PubMed
    1. Paternoster L, et al. Genome-wide association study of three-dimensional facial morphology identifies a variant in PAX3 associated with nasion position. Am J Hum Genet. 2012;90:478–485. - PMC - PubMed
    1. Adhikari K, et al. A genome-wide association scan implicates DCHS2, RUNX2, GLI3, PAX1 and EDAR in human facial variation. Nature Commun. 2016;7:11616. - PMC - PubMed
    1. Liu F, et al. Genetics of skin color variation in Europeans: Genome-wide association studies with functional follow-up. Hum Genet. 2015;134:823–835. - PMC - PubMed