. 2017 Sep 12;114(37):9770-9778.
doi: 10.1073/pnas.1619807114. Epub 2017 Sep 5.

Glacier shrinkage driving global changes in downstream systems

Affiliations

Glacier shrinkage driving global changes in downstream systems

Alexander M Milner et al. Proc Natl Acad Sci U S A. .

Abstract

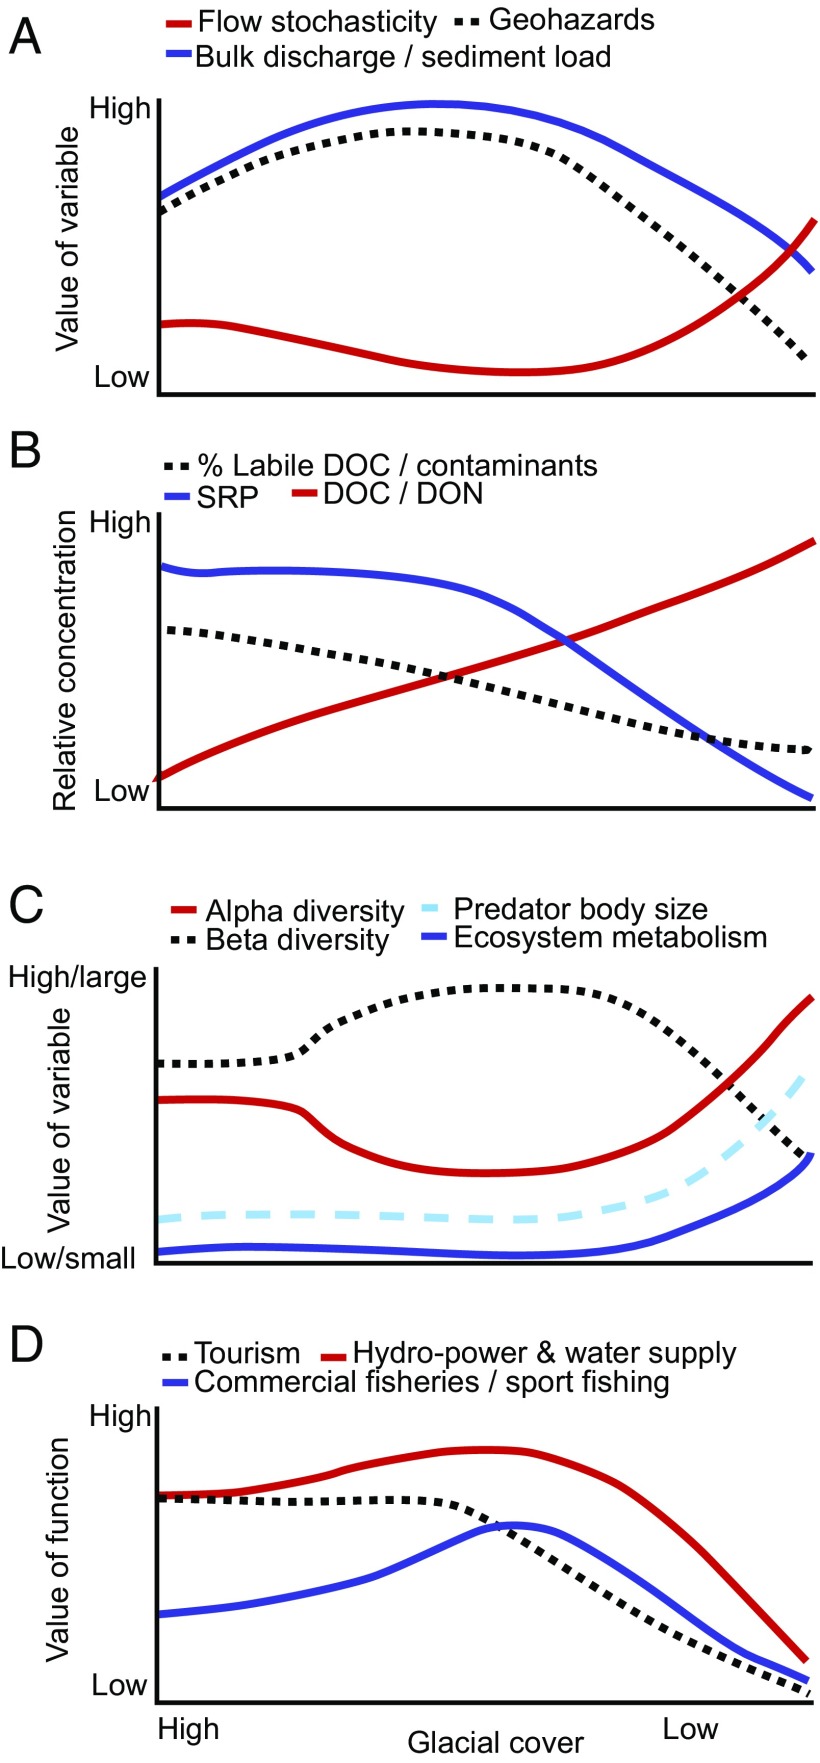
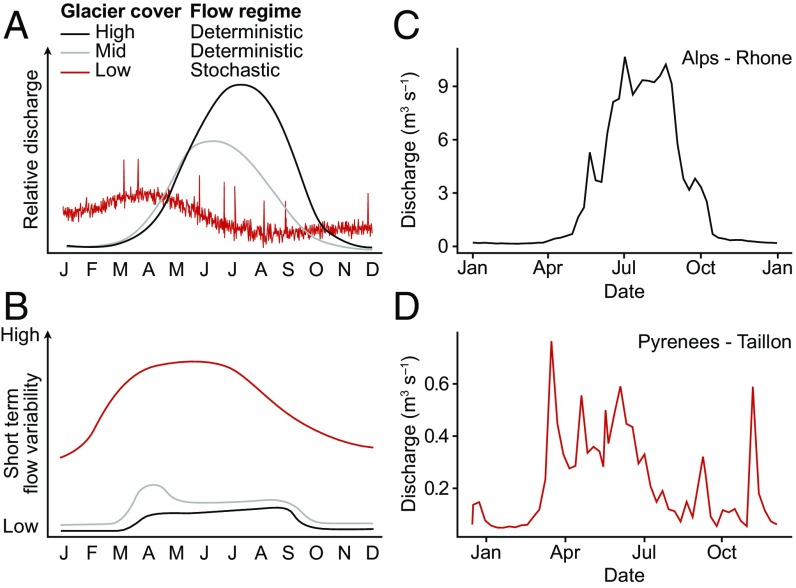
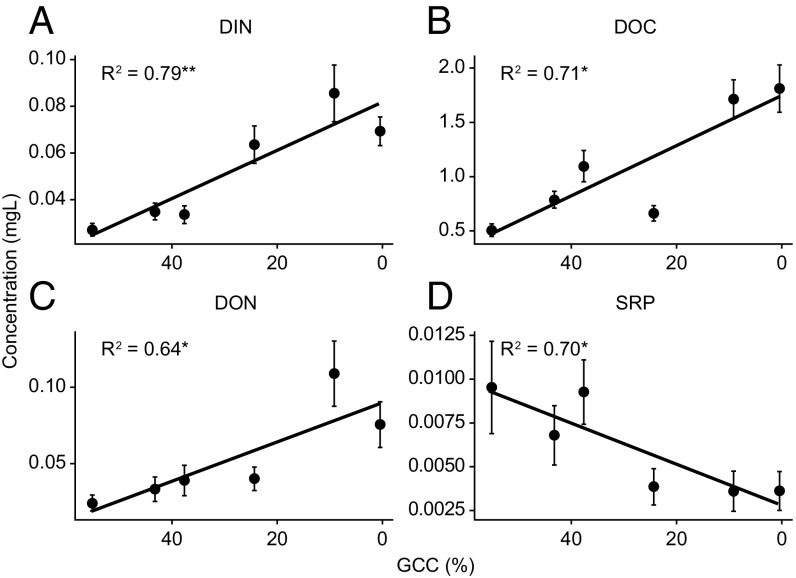
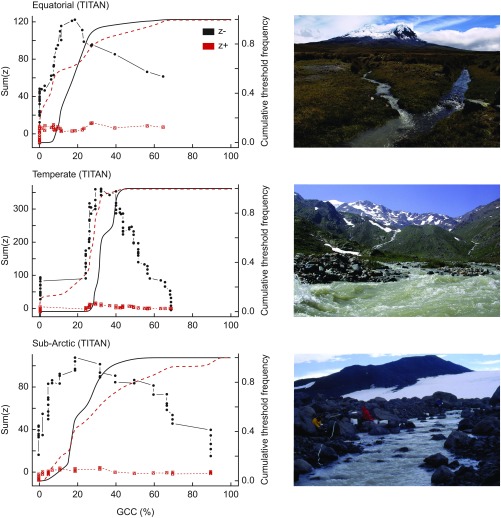
Glaciers cover ∼10% of the Earth's land surface, but they are shrinking rapidly across most parts of the world, leading to cascading impacts on downstream systems. Glaciers impart unique footprints on river flow at times when other water sources are low. Changes in river hydrology and morphology caused by climate-induced glacier loss are projected to be the greatest of any hydrological system, with major implications for riverine and near-shore marine environments. Here, we synthesize current evidence of how glacier shrinkage will alter hydrological regimes, sediment transport, and biogeochemical and contaminant fluxes from rivers to oceans. This will profoundly influence the natural environment, including many facets of biodiversity, and the ecosystem services that glacier-fed rivers provide to humans, particularly provision of water for agriculture, hydropower, and consumption. We conclude that human society must plan adaptation and mitigation measures for the full breadth of impacts in all affected regions caused by glacier shrinkage.

Keywords: biodiversity; biogeochemistry; ecosystem services; glacier; runoff.


Conflict of interest statement

The authors declare no conflict of interest.

Figures

Fig. 1.
Fig. 1.
Conceptual response curves for (A) river flow, geohazards, and sediment load; (B) nutrients and contaminants; (C) ecological community attributes; and (D) ecosystem services for large and small glaciers with decreasing glacial cover. Note that, for each panel, the y axis is relative to the system type (i.e., low discharge for a large valley glacier in A will be greater than low discharge for a small alpine glacier). A–C are based on literature findings as referenced in the text, and D is hypothetical based on understanding.
Fig. 2.
Fig. 2.
(A) Conceptual representation of the changing hydrograph for alpine glacier-fed rivers. For the low-glacier cover scenario, a change in climate is also anticipated: in particular, an increase in the magnitude and frequency of extreme events and a decrease in the fraction of precipitation falling as snow. (B) Hypothesized sensitivity of river flow to extreme events (droughts and high-intensity storms) and short-term flow variability (i.e., variability in the weekly mean discharge); (C) discharge for the Rhone River, Italy with high glacial cover; and (D) discharge of the Taillon River, French Pyrenees with low glacial cover, indicating stochastic discharge events caused by rainfall or rain on snow events.
Fig. S1.
Fig. S1.
Variations in (A) dissolved inorganic nitrogen, (B) dissolved organic carbon, (C) dissolved organic nitrogen, and (D) soluble reactive phosphorus as a function of glacier coverage in the catchment (GCC) *P < 0.05 and **P < 0.01 (47).
Fig. S2.
Fig. S2.
Community change points identified across glacier influence gradients [glacier cover in catchment (GCC)] for equatorial (Ecuador), temperate (Italian Alps), and sub-Arctic (Iceland) systems. Change points were estimated using Threshold indicator taxa analysis (TITAN) (113), a nonparametric technique that orders and partitions observations along the gradient using IndVal scores (114) to define groupings. Multiple candidate change points are identified, and IndVal scores are calculated for each taxon (250 permutations) and then standardized (z scores). Declining (z−) and increasing (z+) taxa are used to identify community-level change points, and uncertainty is estimated via bootstrapping (500 replicates). Photographs represent the individual sites.
Fig. 3.
Fig. 3.
Conceptual framework integrating the effects of glacier shrinkage on provisioning, regulating, and cultural ecosystem services. The outer ring highlights broad groups of ecosystem services provided by glacier-fed watersheds. The inner ring highlights specific services potentially altered by glacier retreat and disappearance. The center highlights the complexity of interactions among the various services, which will necessitate tradeoffs as society adapts to cryospheric change (Table S2).

References

    1. Kaser G, Gogley JG, Dyurgerov MB, Meier MF, Ohmura A. Mass balance of glaciers and ice caps: Consensus estimates for 1961-2004. Geophys Res Lett. 2006;33:L19501.
    1. Pfeffer WT, et al. The Randolph Glacier Inventory: A globally complete inventory of glaciers. J Glaciol. 2014;60:537–552.
    1. Gardner AS, et al. A reconciled estimate of glacier contributions to sea level rise: 2003 To 2009. Science. 2013;340:852–857. - PubMed
    1. Bliss A, Hock R, Radić V. Global response of glacier runoff to twenty-first century climate change. J Geophys Res Earth Surf. 2014;119:717–730.
    1. Jacob T, Wahr J, Pfeffer WT, Swenson S. Recent contributions of glaciers and ice caps to sea-level rise. Nature. 2012;482:514–518. - PubMed

Publication types