. 2017 Sep 19;114(38):10053-10058.
doi: 10.1073/pnas.1702803114. Epub 2017 Sep 5.

Active molecular iodine photochemistry in the Arctic

Affiliations

Active molecular iodine photochemistry in the Arctic

Angela R W Raso et al. Proc Natl Acad Sci U S A. .

Abstract

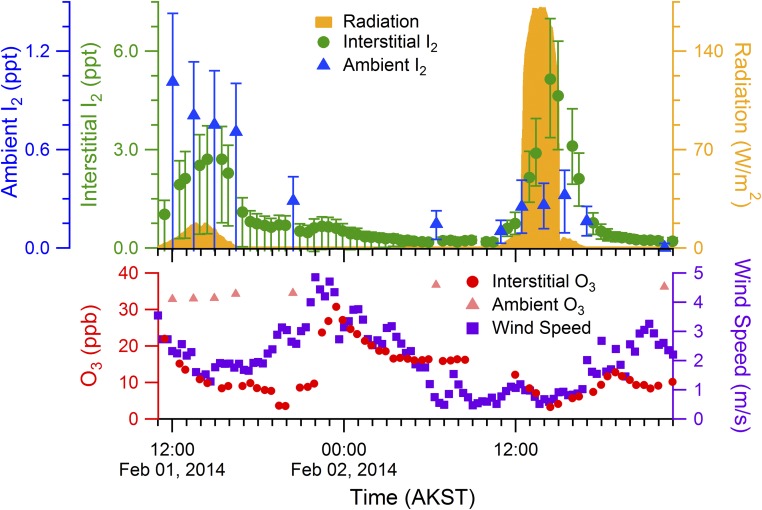
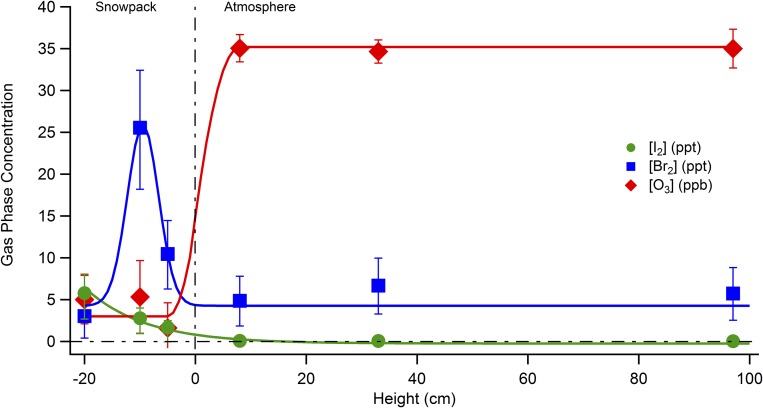
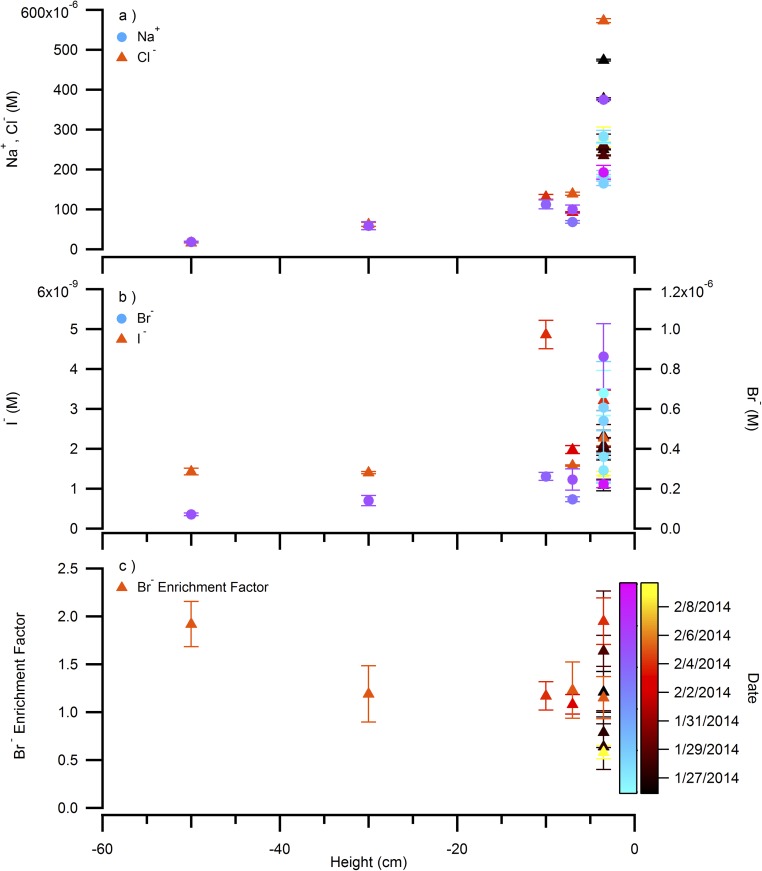
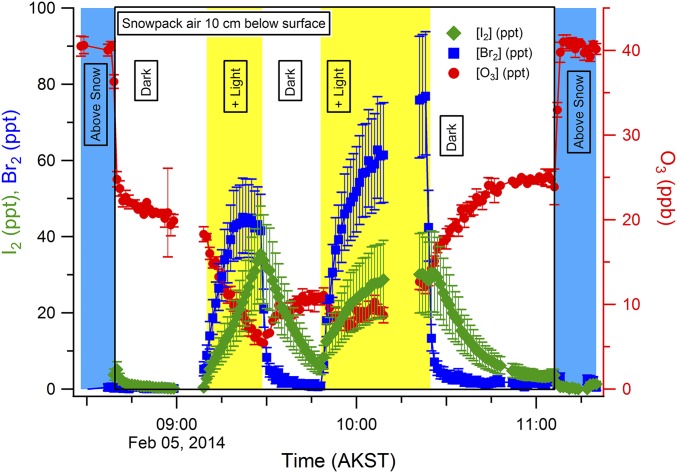
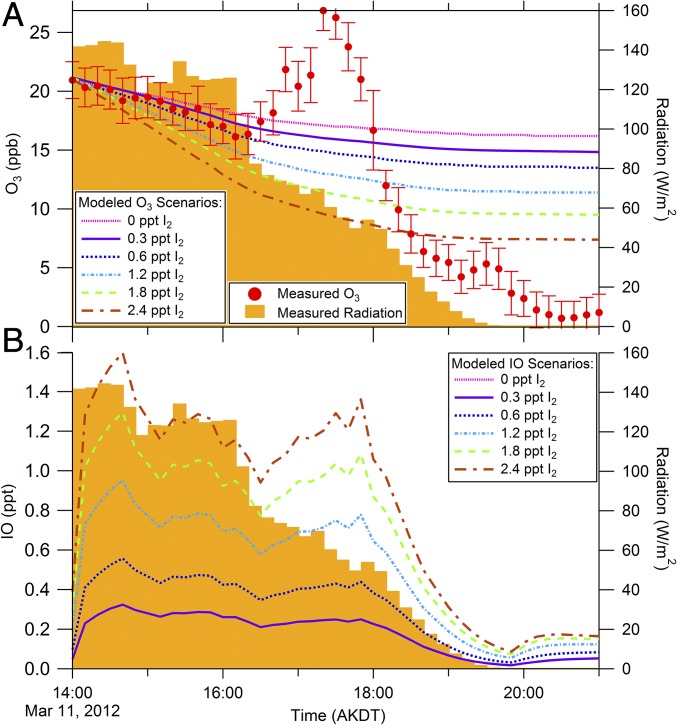
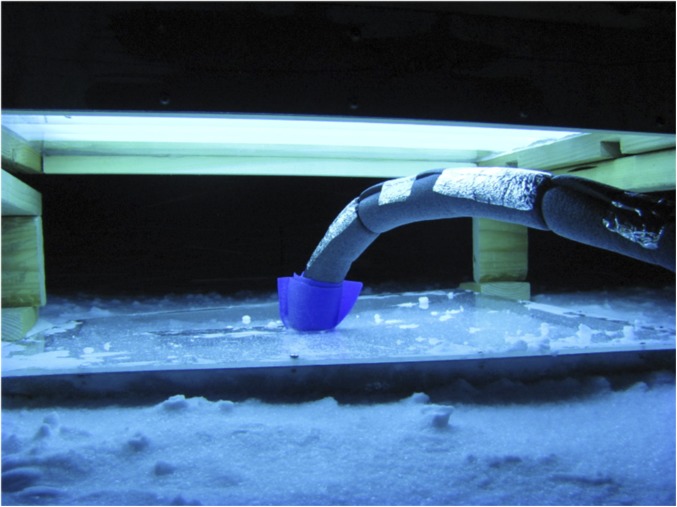
During springtime, the Arctic atmospheric boundary layer undergoes frequent rapid depletions in ozone and gaseous elemental mercury due to reactions with halogen atoms, influencing atmospheric composition and pollutant fate. Although bromine chemistry has been shown to initiate ozone depletion events, and it has long been hypothesized that iodine chemistry may contribute, no previous measurements of molecular iodine (I2) have been reported in the Arctic. Iodine chemistry also contributes to atmospheric new particle formation and therefore cloud properties and radiative forcing. Here we present Arctic atmospheric I2 and snowpack iodide (I-) measurements, which were conducted near Utqiaġvik, AK, in February 2014. Using chemical ionization mass spectrometry, I2 was observed in the atmosphere at mole ratios of 0.3-1.0 ppt, and in the snowpack interstitial air at mole ratios up to 22 ppt under natural sunlit conditions and up to 35 ppt when the snowpack surface was artificially irradiated, suggesting a photochemical production mechanism. Further, snow meltwater I- measurements showed enrichments of up to ∼1,900 times above the seawater ratio of I-/Na+, consistent with iodine activation and recycling. Modeling shows that observed I2 levels are able to significantly increase ozone depletion rates, while also producing iodine monoxide (IO) at levels recently observed in the Arctic. These results emphasize the significance of iodine chemistry and the role of snowpack photochemistry in Arctic atmospheric composition, and imply that I2 is likely a dominant source of iodine atoms in the Arctic.

Keywords: atmosphere; cryosphere; iodine; photochemistry; snowpack.


Conflict of interest statement

The authors declare no conflict of interest.

Figures

Fig. 1.
Fig. 1.
Snowpack halogen production and interstitial air halogen reactions. Major halogen reactions proposed to occur in the interstitial snowpack air and within the snow surface are shown. Oxidation of I in the dark (R6–R8) is based on Carpenter et al. (47). Photochemical oxidation of Br (R9–R12) is based on Abbatt et al. (38). Cl and I photochemical oxidation reactions (R15–R18 and R1–R4, respectively) are suggested to be analogous. Snow crystal SEM image is an open source image from the Electron and Confocal Microscopy Laboratory, Agricultural Research Service, US Department of Agriculture.
Fig. 2.
Fig. 2.
I2, O3, radiation, and wind speeds during February 1–2, 2014. The diurnal profiles for I2 and O3 mole ratios, as well as the radiation and wind speeds, are shown as 20-min averages from February 1 to 2, 2014. Error bars are propagated uncertainties (SI Methods). Ambient measurements were conducted 1 m above the snowpack surface. Interstitial air measurements were conducted 10 cm below the snowpack surface. Fluctuations in interstitial air O3 mole ratios correlate with high wind speeds and are therefore likely due to wind pumping.
Fig. 3.
Fig. 3.
Vertical profiles of near-surface atmospheric and snowpack interstitial air I2, Br2, and O3 mole ratios, as well as snow I enrichment. Gas-phase measurements were made during daylight from 12:22 to 16:23 AKST on February 4, 2014, at heights above (positive) and below (negative) the snowpack surface. Error bars for species measured with CIMS (I2 and Br2) are propagated uncertainties (SI Methods). Error bars on the O3 measurements are the SDs of 9- to 22-min averages at each height. I enrichment factors (the ratio of I to Na+ in snow meltwater relative to the same ratio in seawater) are shown for snow samples collected from January 27 to February 5, 2014. I enrichment factor error bars are the propagated error from three measurements of the I concentration in a single sample. See Fig. S1 for an additional set of vertical profile measurements from February 3, 2014.
Fig. S1.
Fig. S1.
Vertical profiles of I2, Br2, and O3 mole ratios within and above the snowpack on February 3, 2014. Measurements were made alternating in and above the snowpack, starting closest to the snowpack surface. Height points are representative of the position of the snow probe inlet in the snowpack during measurement, and do not include possible errors due to air drawn from the other heights within the snowpack.
Fig. S2.
Fig. S2.
(A) Sodium (Na+), chloride (Cl), (B) iodide (I), and bromide (Br) concentrations, and (C) Br enrichment relative to sea water in snow as a function of depth in the snowpack and sampling date. Error bars are SDs from the average of three replicate measurements.
Fig. 4.
Fig. 4.
Snowpack artificial irradiation experiment. Snowpack interstitial air Br2, I2, and O3 mole ratios are shown as 1-min averages for dark and artificial light measurement periods during an experiment on February 5, 2014. Error bars for I2 and Br2 are propagated uncertainties (SI Methods). The interstitial air measurements were bracketed by near-surface (5 cm above the snowpack surface) measurements of boundary-layer air. The duration of the experiment occurred before the sun rose, allowing for near-complete darkness when the artificial lights were off.
Fig. S3.
Fig. S3.
Radiation spectrum of the UVA 340 lamps used for artificial irradiation (67). The lamps have a peak irradiation wavelength at 340 nm. Aqueous nitrite absorbs very well in this region (20). Aqueous hydrogen peroxide photolyzes best at wavelengths less than 320 nm (20). Gas-phase I2 and Br2 have peak absorbance at 420 and 530 nm, respectively (20, 51).
Fig. 5.
Fig. 5.
Model results show the influence of I2 on (A) tropospheric ozone depletion rates and (B) IO mole ratios. An ozone depletion event occurring on March 11, 2012 was simulated with I2 mole ratios between 0 and 2.4 ppt. Cl2, Br2, and HOBr were constrained to measurements as shown in Fig. S4. (A) Measured O3 with SDs of the 10-min average, and model results showing simulated O3 mole ratios. (B) Simulated IO mole ratios during the same period.
Fig. S4.
Fig. S4.
Measurement data from March 11, 2012, used to constrain ambient photochemical modeling. Other starting mole ratios for the model can be found in Table S3.
Fig. S5.
Fig. S5.
The snow probe used to exclude snow from the sampling line during snowpack air measurement. Photograph courtesy of S. McNamara (University of Michigan, Ann Arbor, MI).
Fig. S6.
Fig. S6.
Artificial light fixture suspended above the snowpack cover. As described in Methods, the artificial light fixture was suspended ∼10 cm above the Acrylite snow cover. The sampling line was inserted into the hole in the snowpack through a ∼6-cm-diameter hole, which was partially sealed using silicone sheets.

References

    1. Barrie LA, Bottenheim JW, Schnell RC, Crutzen PJ, Rasmussen RA. Ozone destruction and photochemical reactions at polar sunrise in the lower Arctic atmosphere. Nature. 1988;334:138–141.
    1. Oltmans SJ. Surface ozone measurements in clean air. J Geophys Res. 1981;86:1174–1180.
    1. Sturges WT, Barrie LA. Chlorine, bromine, and iodine in Arctic aerosols. Atmos Environ. 1988;22:1179–1194.
    1. Barrie LA, den Hartog G, Bottenheim JW, Landsberger S. Anthroprogenic aerosols and gases in the lower troposphere at Alert Canada in April 1986. J Atmos Chem. 1989;9:101–127.
    1. Liao J, et al. Observations of inorganic bromine (HOBr, BrO, and Br2) speciation at Barrow, Alaska, in spring 2009. J Geophys Res. 2012;117:D00R16.

Publication types

LinkOut - more resources