. 2017 Sep 19;114(38):E7997-E8006.
doi: 10.1073/pnas.1705768114. Epub 2017 Sep 5.

Dual role of mitochondria in producing melatonin and driving GPCR signaling to block cytochrome c release

Affiliations

Dual role of mitochondria in producing melatonin and driving GPCR signaling to block cytochrome c release

Yalikun Suofu et al. Proc Natl Acad Sci U S A. .

Abstract

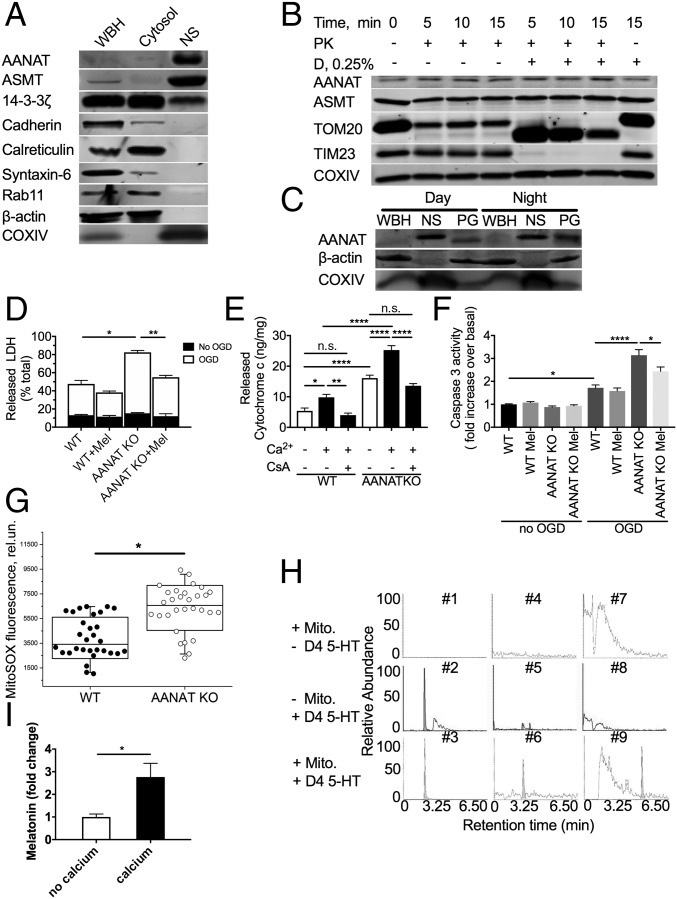
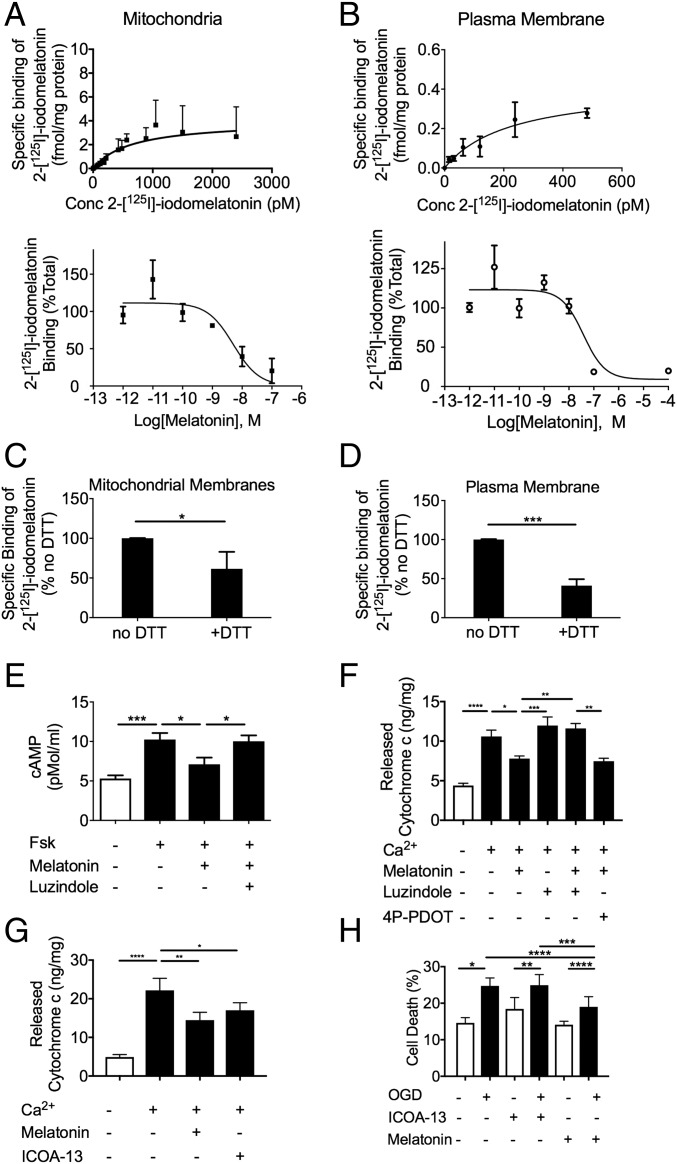
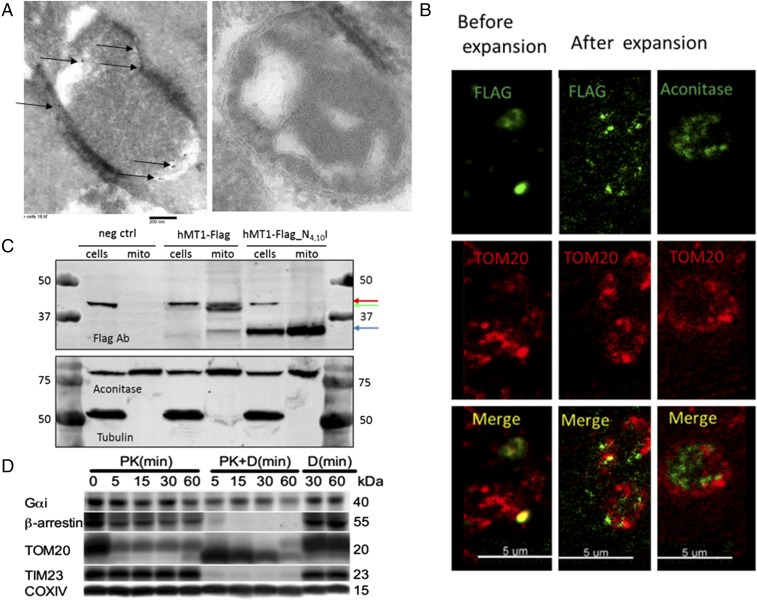
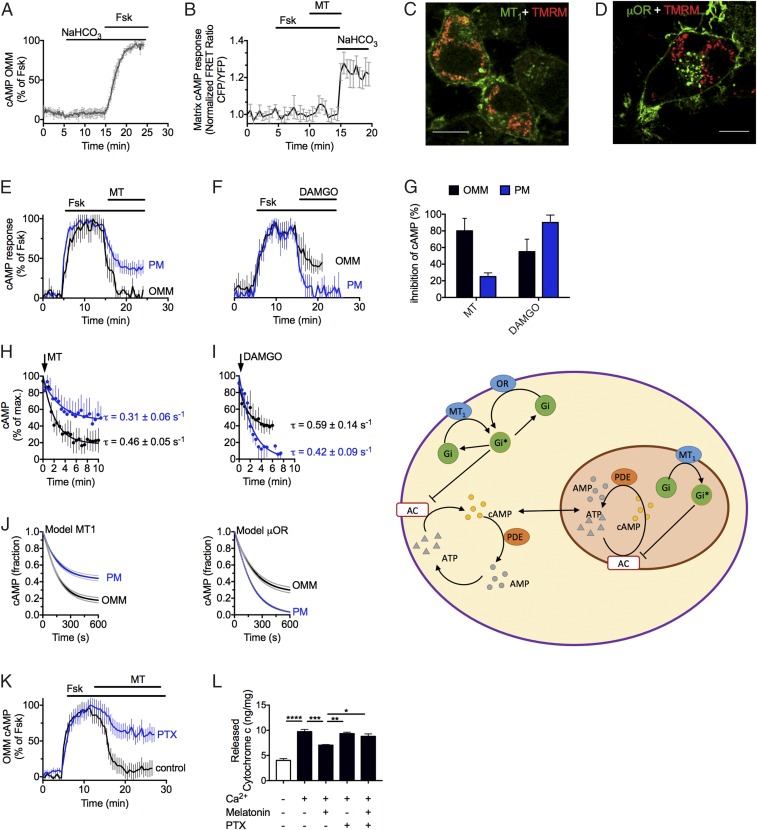
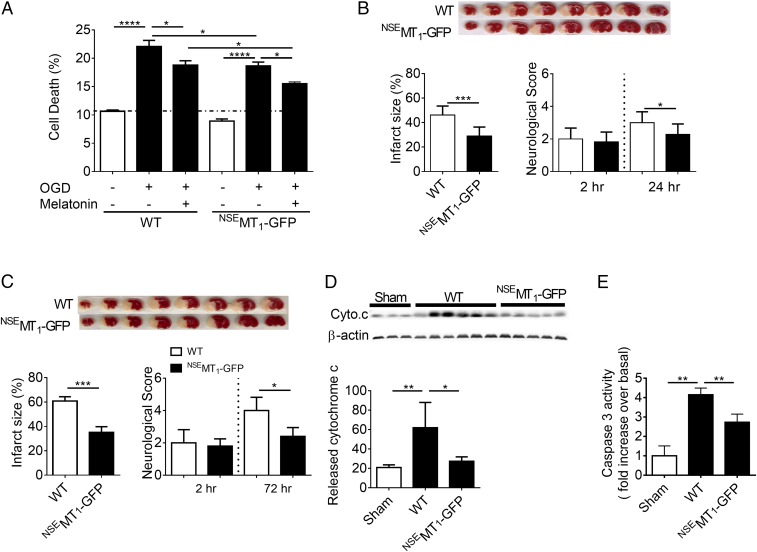
G protein-coupled receptors (GPCRs) are classically characterized as cell-surface receptors transmitting extracellular signals into cells. Here we show that central components of a GPCR signaling system comprised of the melatonin type 1 receptor (MT1), its associated G protein, and β-arrestins are on and within neuronal mitochondria. We discovered that the ligand melatonin is exclusively synthesized in the mitochondrial matrix and released by the organelle activating the mitochondrial MT1 signal-transduction pathway inhibiting stress-mediated cytochrome c release and caspase activation. These findings coupled with our observation that mitochondrial MT1 overexpression reduces ischemic brain injury in mice delineate a mitochondrial GPCR mechanism contributing to the neuroprotective action of melatonin. We propose a new term, "automitocrine," analogous to "autocrine" when a similar phenomenon occurs at the cellular level, to describe this unexpected intracellular organelle ligand-receptor pathway that opens a new research avenue investigating mitochondrial GPCR biology.

Keywords: G protein-coupled receptor; ischemia; melatonin; mitochondria; neuroprotection.


Conflict of interest statement

The authors declare no conflict of interest.

Figures

Fig. 1.
Fig. 1.
Key enzymes in melatonin synthesis are located in neuronal mitochondria matrix, and melatonin is synthesized in mitochondria. (A) Immunoblotting of fractionated 6-wk-old B6CBA mouse brain; n = 3. (B) Immunoblotting of lysates following proteinase K (PK) digestion with/without digitonin (D). Nonsynaptosomal mitochondria from 6-wk-old B6CBA mice were incubated with proteinase K or proteinase K plus digitonin for the times indicated. Following digestion, protease inhibitors were added, and lysates were subjected to immunoblotting; n = 3. (C) Whole-brain homogenate (WBH), nonsynaptosomal mitochondria (NS), and pineal gland (PG) lysates were isolated during the daytime (2:00 PM) or night (2:00 AM) for immunoblotting with anti-AANAT antibody; n = 3. (D) LDH release from N2a and N2a-AANAT–KO cells under optimal conditions demonstrating background LDH release for each cell line (black portion of bars) compared with LDH release after OGD-induced stress (white portion of bars); n = 3. (E) Calcium-induced cytochrome c release from crude mitochondria isolated from N2a and N2a-AANAT–KO cells with or without cyclosporine A (10 μM) treatment; n = 3. After stress, AANAT-KO cells are more vulnerable than parental cells. (F) Caspase 3 activity from N2a wild-type and N2a-AANAT–KO cells was evaluated following OGD-induced stress with or without melatonin presence; n = 3. (G) N2a cells (WT and AANAT-KO) plated in the same multiwell plates were incubated with MitoSOX reagent, and fluorescence was measured using λex/em = 510/580 nm. P < 0.001 (n = 30). (H) Representative chromatograms showing metabolites extracted from mitochondria incubated in control buffer with mitochondria but no 4d-serotonin (#1, 4, and 7), with d4-serotonin in the absence of mitochondria (#2, 5, and 8), or with d4-serotonin and mitochondria (#3, 6, and 9). Samples incubated with buffer alone (#1, 3, and 5) show no presence of d4-labeled metabolites. Samples incubated with d4-serotonin show detected levels of unprocessed d4-serotonin (#2 and 3, retention time 1.65 min), d4-N-acetyl-serotonin (#6, retention time 2.28 min), and d4-melatonin (#9, retention time 4.45 min). This experiment was repeated three times; a representative result is shown. (I) Melatonin release from purified mouse brain mitochondria upon calcium-induced stress. The value expressed is after normalization to no calcium control, n = 4. For all panels, *P < 0.05, **P < 0.01, ****P < 0.0001, n.s., not significant. Error bars represent SEM.
Fig. 2.
Fig. 2.
MT1 signaling in isolated mitochondria from mice brains. (A and B) Comparison between the binding properties (Ki, Kd, Bmax) of melatonin receptors located in mitochondria (A) or PM (B) isolated from mouse brains. Composite graphs were fit by nonlinear regression yielding Kd = 641 pM, Bmax = 4.0 fmol/mg protein, Ki = 2.4 nM (A) and Kd = 225 pM, Bmax = 0.42 fmol/mg protein, Ki = 20 nM (B). (C and D) Quantification of 2-[125I]-iodomelatonin binding in the absence or presence of 1 mM DTT on mitochondrial membrane extracts (C) or PM (D) isolated from mouse brains. Nonspecific binding was determined in the presence of 10 μM melatonin. (E) cAMP levels of isolated synaptosomal mitochondria from wild-type mice treated with or without 10 μM forskolin (Fsk), 10 μM melatonin, and/or 100 μM luzindole. (F) Calcium-induced cytochrome c release from isolated mitochondria. Melatonin (10 μM) was incubated alone or in combination with luzindole (100 μM) or 4P-PDOT (100 μM). (G) Calcium-induced cytochrome c release from isolated mitochondria incubated with either melatonin (10 μM) or ICOA-13 (100 μM). (H) N2a cells exposed to OGD for 6 h and then grown in regular medium at normoxia in the presence of melatonin (40 μM) or ICOA-13 (40 μM). LDH was used to evaluate cell death. Bars represent the mean value ± SEM of n = 3 in AC; n = 5 in E; and n = 4 in F. *P < 0.05, **P < 0.01, ***P < 0.001, and ****P < 0.0001 indicate a significant difference.
Fig. 3.
Fig. 3.
MT1-FLAG in neuronal mitochondria. (A) Transmission electron microscopy of an isolated mitochondrion from a MT1-FLAG–transfected (Left) or untransfected (Right) N2a cell. Sections were incubated with FLAG antibody and immunogold secondary antibody before imaging. Arrows indicate positive staining. (B) Expansion microscopy of mitochondria isolated from MT1-FLAG–transfected N2a cells and then fixed with 4% PFA for 5 min and permeabilized with Triton X-100 for 10 min. (Left) Mitochondria before expansion. (Center) Mitochondrial immunostaining of MT1-FLAG and TOM20 after expansion. (Right) Controls demonstrate aconitase staining in the mitochondrial matrix and TOM20 staining on the outer membrane. (C) Immunoblot of control N2a cell lysates and MT1-FLAG– or MT1-FLAG glycosylation mutant vector–transfected N2a cell lysates. The red arrow indicates a background band, the green arrow indicates glycosylated MT1, and the blue arrow indicates nonglycosylated MT1. (D) Orientation of MT1 signaling partners on the mitochondrial membrane. Purified mitochondria were treated with proteinase K (PK) alone or in combination with digitonin (PK+D) for the times indicated followed by immunoblot analysis of Gαi, β-arrestins, TOM20, TIM23, and COX IV. Representative images are shown; all experiments were performed at least in triplicate.
Fig. 4.
Fig. 4.
MT1 signaling in living N2a cells. (A and B) Averaged time courses of mitochondrial cAMP production in response to forskolin (Fsk) and bicarbonate (NaHCO3) (A) or to melatonin (MT) (B) in N2a cells when the FRET-based cAMP biosensor is localized in either the outer membrane (A) or the matrix (B). Cells were continuously perfused with buffer or stimuli (10 µM) for the time indicated by the horizontal bar. Data represent the mean value ± SEM of n = 16 cells. (C and D) Confocal imaging of N2a cells expressing MT1-GFP (C, green) or μOR-GFP (D, green) together with the mitochondrial marker TMRM (red). µOR-GFP localizes exclusively in the cell surface, whereas MT1 is also detected at mitochondria. (Scale bars, 10 μm.) (E and F) Examples of cAMP recording in single cells expressing FRET-based cAMP sensors at either the PM or the OMM and MT1 (E) or µOR (F). (GI) Averaged maximal inhibition of cAMP (G) and averaged kinetics (H and I). Data represent the mean value ± SEM of four independent experiments (n = 15–40 cells). (J, Left) Comparison of simulated time courses of cAMP inhibition for model 1 (µOR–GPCR at the PM only) and model 2 (MT1–GPCR at the PM and OMM). (Right) A schematic of these models. (K) Averaged time courses of the inhibitory action of melatonin on forskolin-stimulated cAMP in the OMM of N2a cells without (control) or with PTX. Data shown are the mean value ± SEM of three independent experiments (n = 25–35 cells). (L) Effect of PTX (1 ng/mL) on calcium-induced cytochrome c release from isolated mitochondria with or without melatonin (10 μM). Bars represent the mean value ± SEM of five independent experiments. *P < 0.05, **P < 0.01, ***P < 0.001, ****P < 0.0001 indicate a significant difference.
Fig. 5.
Fig. 5.
MT1 overexpression ameliorates brain injury after permanent cerebral ischemia. (A) OGD-induced cell death of PCN from NSEMT1-GFP mice. Melatonin (MT, 10 μM) treatment of PCN from NSEMT1-GFP embryos further reduced OGD-induced cell death. Bars represent the mean value ± SEM of three to six experiments. (B and C) Representative TTC-stained images of wild-type and NSEMT1-GFP murine brain sections at 24 h (B, n = 10 WT and n = 11 NSEMT1-GFP sections) and 72 h (C, n = 4 WT and n = 5 NSEMT1-GFP sections). Infarct size and neurological scores were measured at 24 h (B) and 72 h (C) after induction of cerebral ischemia. (D and E) Release of cytochrome c from mitochondria into cytosol (D) and activation of caspase-3 (E) in wild-type or NSEMT1-GFP mouse brains following 24 h permanent cerebral ischemia compared with sham surgical (anesthesia and carotid dissection only) controls in wild-type mice. Data represent the mean value ± SD; *P < 0.05, **P < 0.01, ***P < 0.001, and ****P < 0.0001 indicate a significant difference.

Comment in

References

    1. Wang X, et al. Methazolamide and melatonin inhibit mitochondrial cytochrome C release and are neuroprotective in experimental models of ischemic injury. Stroke. 2009;40:1877–1885. - PMC - PubMed
    1. Poeggeler B, et al. Melatonin reverses the profibrillogenic activity of apolipoprotein E4 on the Alzheimer amyloid Abeta peptide. Biochemistry. 2001;40:14995–15001. - PubMed
    1. Zhang Y, et al. Melatonin inhibits the caspase-1/cytochrome c/caspase-3 cell death pathway, inhibits MT1 receptor loss and delays disease progression in a mouse model of amyotrophic lateral sclerosis. Neurobiol Dis. 2013;55:26–35. - PMC - PubMed
    1. Wang X, et al. The melatonin MT1 receptor axis modulates mutant Huntingtin-mediated toxicity. J Neurosci. 2011;31:14496–14507. - PMC - PubMed
    1. Reiter RJ, et al. Melatonin ameliorates neurologic damage and neurophysiologic deficits in experimental models of stroke. Ann N Y Acad Sci. 2003;993:35–47, discussion 48–53. - PubMed

Publication types