. 2017 Sep 5;8(1):435.
doi: 10.1038/s41467-017-00451-5.

Phenotype-driven precision oncology as a guide for clinical decisions one patient at a time

Affiliations

Phenotype-driven precision oncology as a guide for clinical decisions one patient at a time

Shumei Chia et al. Nat Commun. .

Abstract

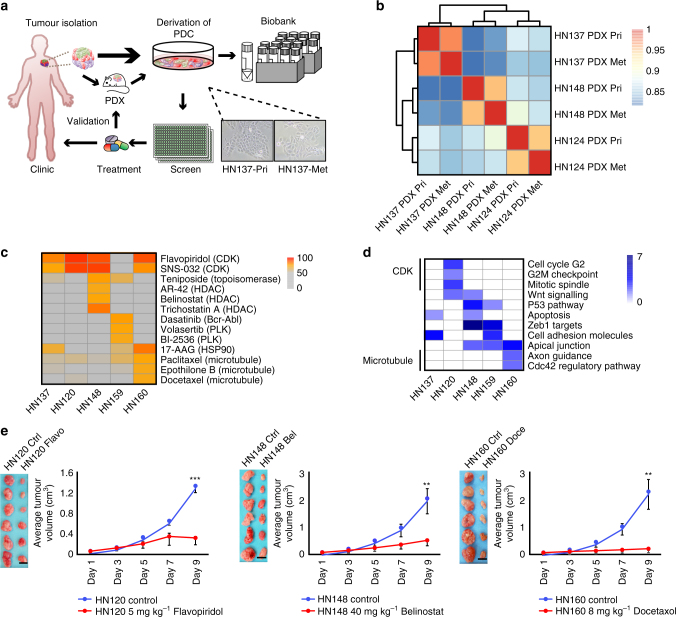
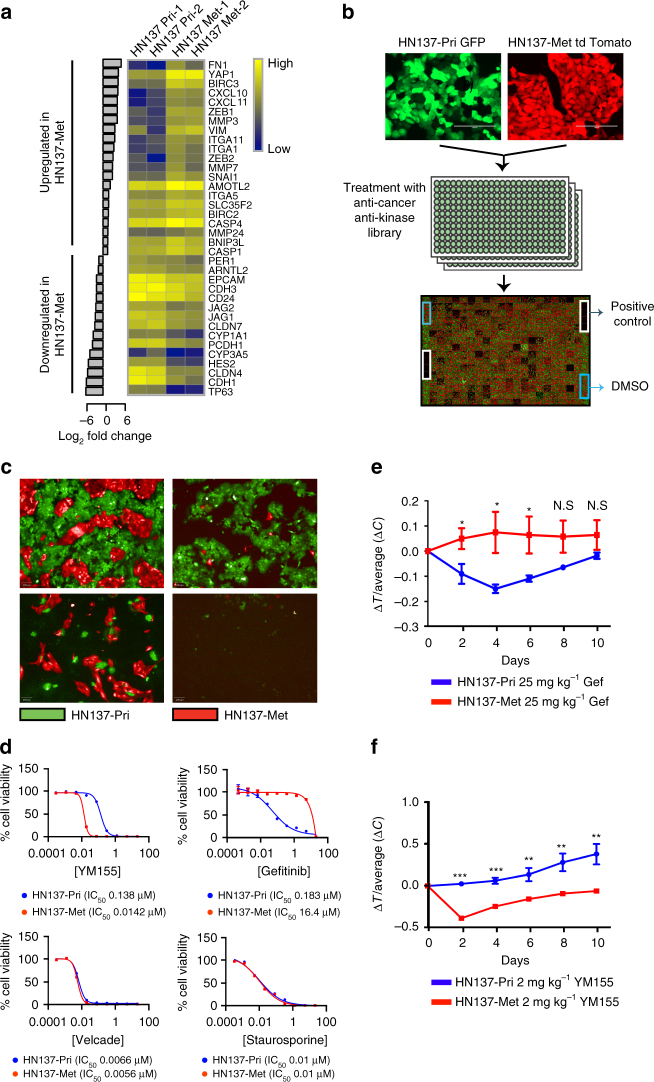
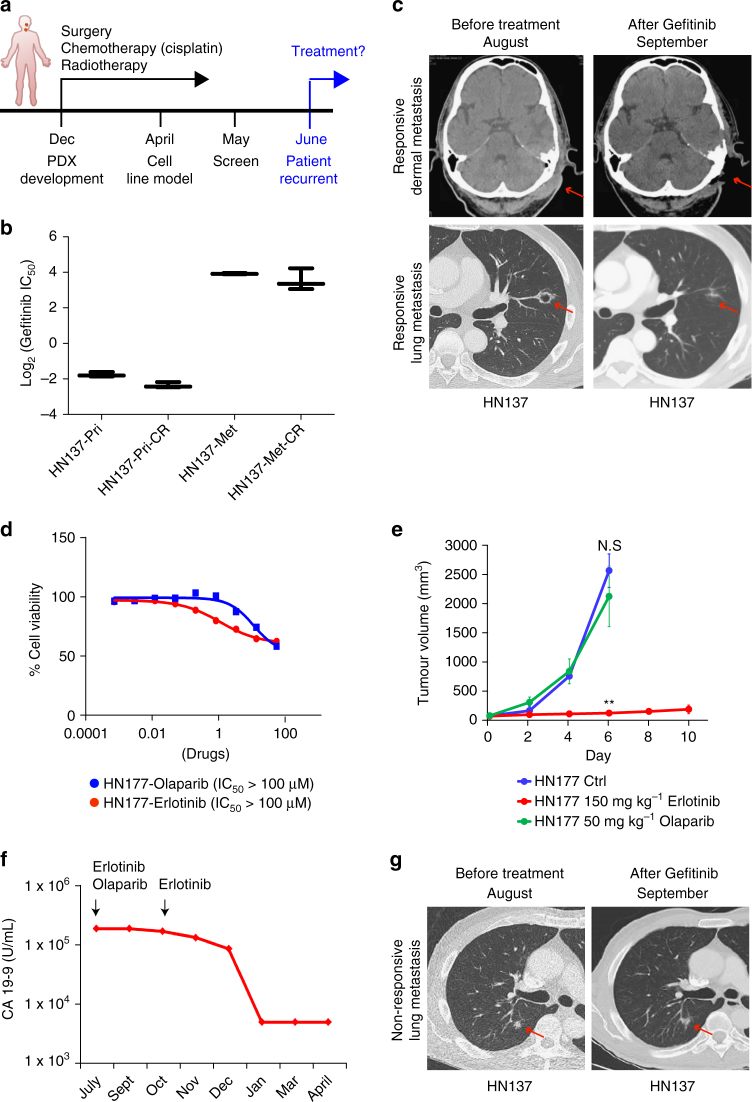
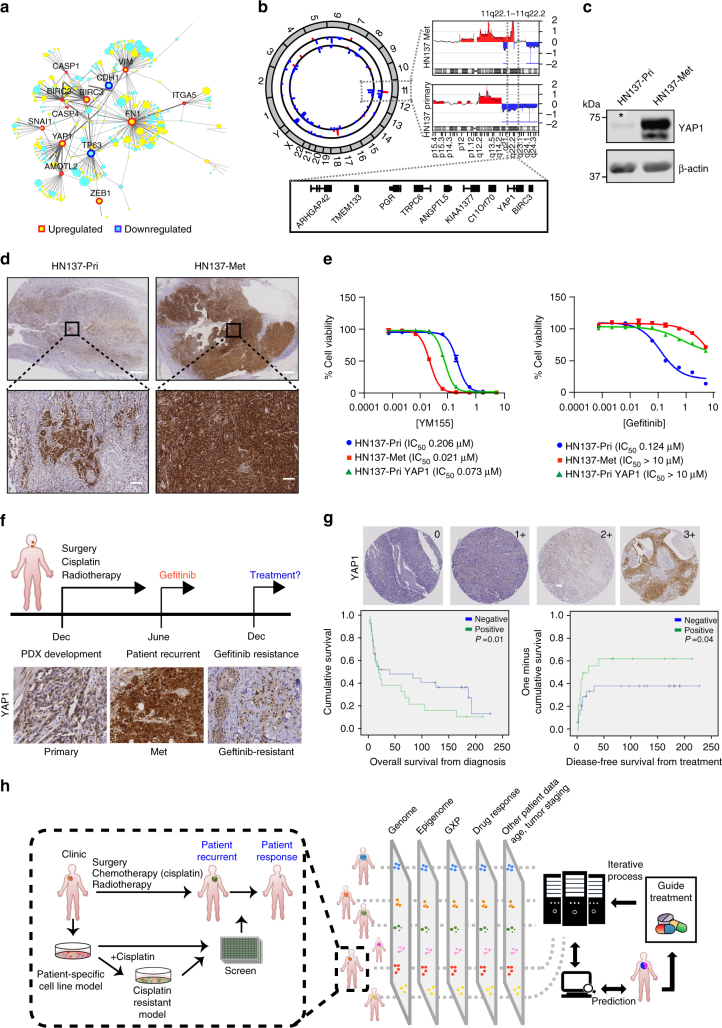
Genomics-driven cancer therapeutics has gained prominence in personalized cancer treatment. However, its utility in indications lacking biomarker-driven treatment strategies remains limited. Here we present a "phenotype-driven precision-oncology" approach, based on the notion that biological response to perturbations, chemical or genetic, in ex vivo patient-individualized models can serve as predictive biomarkers for therapeutic response in the clinic. We generated a library of "screenable" patient-derived primary cultures (PDCs) for head and neck squamous cell carcinomas that reproducibly predicted treatment response in matched patient-derived-xenograft models. Importantly, PDCs could guide clinical practice and predict tumour progression in two n = 1 co-clinical trials. Comprehensive "-omics" interrogation of PDCs derived from one of these models revealed YAP1 as a putative biomarker for treatment response and survival in ~24% of oral squamous cell carcinoma. We envision that scaling of the proposed PDC approach could uncover biomarkers for therapeutic stratification and guide real-time therapeutic decisions in the future.Treatment response in patient-derived models may serve as a biomarker for response in the clinic. Here, the authors use paired patient-derived mouse xenografts and patient-derived primary culture models from head and neck squamous cell carcinomas, including metastasis, as models for high-throughput screening of anti-cancer drugs.

Trial registration: ClinicalTrials.gov NCT02806388.


Conflict of interest statement

The authors declare no competing financial interests.

Figures

Fig. 1
Fig. 1
Establishing a library of screenable in vitro and in vivo patient-specific squamous cell carcinoma (SCC) models for identification of therapeutic vulnerabilities. a Schematic representation of the pipeline for the generation of patient-personalized in vitro and in vivo models that can serve as a screening platform for uncovering therapeutic vulnerabilities. Resected tumours from human patients were grafted into NSG mice for the establishment of in vivo patient-derived xenograft (PDX) models, and for expansion of tumour material. Patient-derived primary culture (PDC) models were also derived and screened against small molecule libraries for identification of patient-specific therapeutics. Sections of patient tumours, as well as freeze-viable PDX and PDC models were stored in our biobank. Representative images of HN137-Pri and HN137-Met cultures are shown. b Hierarchical clustering of gene expression profiles for HN124, HN137 and HN148 paired primary (Pri) and metastatic (Met) PDXs in duplicates. Scale bar denotes Pearson’s correlation coefficient r from 0.8 (blue) to 1 (red). c Heat map of selected anti-cancer compounds exhibiting strong inhibition in at least one of the PDC lines. The scale represents percentage inhibition of the compounds, with inhibition score <50% shown in grey. d Selected molecular signatures (P < 0.05) of genes that show elevated expressions across the five Met cell lines, some of which appear to be associated with the selective responses of PDC lines to compounds of same target classes. e Six independent cohorts of mice (n = 6) bearing patient-matched PDX in one flank were treated with vehicle (control), 5 mg kg−1 Flavopiridol (HN120), 40 mg kg−1 Belinostat (HN148) and 8 mg kg−1 Docetaxol (HN160). Scale bar, 1 cm. Error bars represent mean ± s.e.m. Two-tail Student’s t test was carried out between treatment and control groups on day 9 tumour weight. **P value <0.01 and ***P value <0.001
Fig. 2
Fig. 2
Small molecule screen against HN137 PDC revealed patient-specific therapeutic vulnerabilities validates in vivo. a Differentially expressed genes (fold-change >2) in HN137-Met vs. HN137-Pri. The heat map represents (Log10) normalized gene expression data in duplicates. b Schema of the co-culture chemical screen performed in triplicate. c Representative fluorescence images of cells treated with compounds specifically targeting either HN137-Pri (bottom left), HN137-Met (top right) or both (bottom right). Scale bars, 100 μm. d Secondary validation of HN137-Met-specific cytotoxic compound (YM155), HN137-Pri-specific cytotoxic compound (gefitinib) and dual cytotoxic compounds (Velcade and Staurosporine). Experiments were performed at least twice, in triplicates. Cell viability was determined using CellTiter-Glo reagent. Triplicate data, error bars represent mean ± s.d. e Four independent cohorts of male mice (n = 5), bearing tumours in both flanks from HN137-Pri PDX and HN137-Met PDX, were treated with vehicle (control), or 25 mg kg−1 gefitinib (Gef). Note that the HN137-Pri PDX display greater response to gefitinib compared to HN137-Met PDX at earlier days (Days 2-6). Error bars represent mean ± s.e.m. Two-tail Student’s t test was carried out between HN137-Pri and HN137-Met for days 2-10; N.S.: not significant, *P < 0.05. f Four independent cohorts of male mice (n = 5), bearing tumours on both flanks from HN137-Pri PDX and HN137-Met PDX, were treated with 2 mg kg−1 of YM155, compared to vehicle (control). A significant anti-tumour effect was observed for YM155 treatment in HN137-Met PDX while HN137-Pri PDX did not display significant sensitivity to YM155. Two-tail Student’s t test was carried out between HN137-Pri and HN137-Met for days 2-10; *P < 0.05, **P < 0. 01, ***P < 0. 001
Fig. 3
Fig. 3
PDC/PDX-guided treatment of patients under two independent n = 1 co-clinical trials. a Timeline for patient HN137 from surgery (December), adjuvant chemo-radiation therapy, until tumour recurrence in June. b Graph denoting Log2(IC50) values of HN137-Pri, HN137-Pri cisplatin resistant (CR), HN137-Met, HN137-Met cisplatin resistant (CR) cell lines in the presence of gefitinib. c Computed tomography scan (CT-scan) of recurrent responsive metastatic sites (dermal metastasis (top panel) and lung metastasis (bottom panel)) in HN137 patient, before and after treatment with 250 mg per day of gefitinib. Arrows denote sites of tumours before and after treatment. d Dose response of HN177-PDC to erlotinib and olaparib. Cell viability was determined using CellTiter-Glo reagent. Triplicate data, error bars represent mean ± s.d. e Three independent cohorts of mice (n = 2 for control and n = 3 for treated) bearing HN177-PDX in one flank were treated with vehicle control (Ctrl), 50 mg kg−1 olaparib and 150 mg kg−1 erlotinib. Error bars represent mean ± s.e.m. Two-tail Student’s t test was carried out between olaparib and control group (N.S.: not significant) and between erlotinib and control group **P value <0.01. f Changes in serum carbohydrate antigen 19-9 (CA 19-9) at initial time of diagnosis and during the course of treatment. g CT-scan of recurrent non-responsive lung metastasis in HN137 patient, before and after treatment with 250 mg day−1 of gefitinib. Arrows denote sites of tumours before and after treatment
Fig. 4
Fig. 4
YAP1 expression as a biomarker for differential therapeutic sensitivity, patient survival, metastatic progression and gefitinib resistance. a Protein-protein interaction (PPI) network of differentially expressed genes between HN137-Pri and HN137-Met related to inhibitor-of-apoptosis (IAPs). The width of the edges is proportional to the number of evidences supporting the interaction. Nodes in yellow denotes that the genes that are upregulated in HN137-Met, whereas blue denotes downregulation. The size of the nodes is proportional to magnitude of fold change. b Circos plot depicting global amplification (red) and deletion (blue) in HN137-Pri (inner track) and HN137-Met (outer track) genomes. Region of amplification found on chromosome 11 in HN137-Met is shown on the right. c Western blot for YAP1 expression in HN137-Pri and HN137-Met cells. Asterisk denotes band depicting low level of YAP1 expression in HN137-Pri cells. d IHC staining of HN137-Pri and HN137-Met tissue specimens for YAP1 expression. Bottom panels display higher magnification images of regions marked in black boxes. Positive cells were visualized by DAB staining. Scale bar, 2 mm (top panel), 100 μm (bottom panel). e Dose-response curve for HN137-Pri, HN137-Met and HN137-Pri cells stably overexpressing YAP1 (HN137-Pri YAP1) to YM155 (left panel) and gefitinib (right panel). Experiments were performed at least twice, in triplicates. Cell viability was determined using CellTiter-Glo reagent. Error bars represent mean ± s.d. f Timeline for patient HN137 from surgery and post-operative chemotherapy (Dec), gefitinib treatment (June) till development of gefitinib-resistant dermal metastasis. IHC staining for YAP1 in HN137-Pri, HN137-Met and HN137 gefitinib-resistant dermal biopsy sample (HN137-Gef-R). Positive cells were visualized by DAB staining. Scale bar, 100 μm. g Representative IHC staining for YAP1 in (n = 166) OSCC patient set from Iyer et al.. Graded intensities (0, 1+, 2+ and 3+) of YAP1 nuclear staining shown in the upper right corner (left panel). Scale bar, 100 μm. Kaplan-Meier survival analysis for YAP1 expression (positive: 1+, 2+, 3+; negative: 0) was done. Overall survival from diagnosis (middle panel) (Log-rank P value = 0.01), and disease-free survival from treatment (right panel) (Log-rank P value = 0.04) are depicted in number of days. h An overview of scaling the proposed “phenotype-driven precision oncology” approach to identify prognostic molecular signatures for treatment response

References

    1. Meric-Bernstam, F. et al. A decision support framework for genomically informed investigational cancer therapy. J. Natl Cancer Inst. 107, djv098 (2015). - PMC - PubMed
    1. Garraway LA. Genomics-driven oncology: framework for an emerging paradigm. J. Clin. Oncol. 2013;31:1806–1814. doi: 10.1200/JCO.2012.46.8934. - DOI - PubMed
    1. Uzilov AV, et al. Development and clinical application of an integrative genomic approach to personalized cancer therapy. Genome Med. 2016;8:62. doi: 10.1186/s13073-016-0313-0. - DOI - PMC - PubMed
    1. Jones S, et al. Personalized genomic analyses for cancer mutation discovery and interpretation. Sci. Transl. Med. 2015;7:283ra253. doi: 10.1126/scitranslmed.aaa7161. - DOI - PMC - PubMed
    1. Xue Y, Wilcox WR. Changing paradigm of cancer therapy: precision medicine by next-generation sequencing. Cancer Biol. Med. 2016;13:12–18. doi: 10.20892/j.issn.2095-3941.2016.0003. - DOI - PMC - PubMed

Publication types

MeSH terms

Associated data