. 2017 Sep 5;7(1):10574.
doi: 10.1038/s41598-017-10269-2.

Targeted error-suppressed quantification of circulating tumor DNA using semi-degenerate barcoded adapters and biotinylated baits

Affiliations

Targeted error-suppressed quantification of circulating tumor DNA using semi-degenerate barcoded adapters and biotinylated baits

Miguel Alcaide et al. Sci Rep. .

Abstract

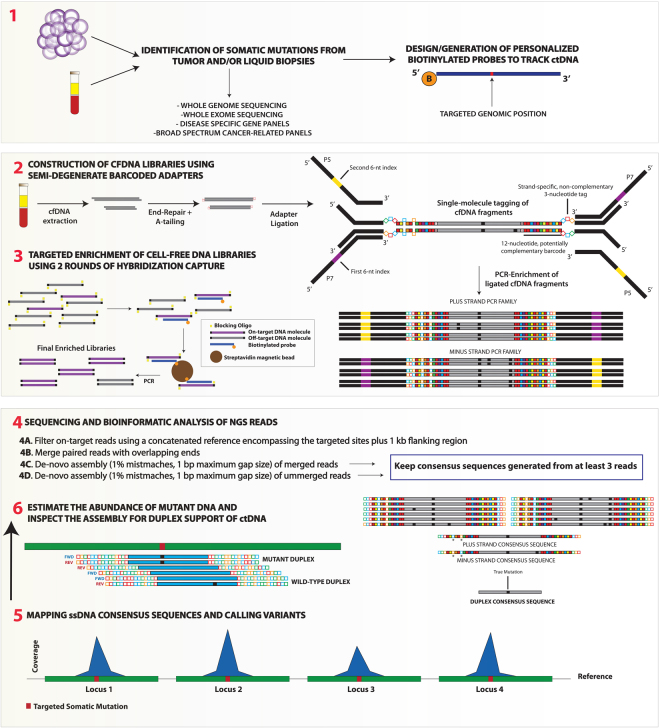
Ultrasensitive methods for rare allele detection are critical to leverage the full potential offered by liquid biopsies. Here, we describe a novel molecular barcoding method for the precise detection and quantification of circulating tumor DNA (ctDNA). The major benefits of our design include straightforward and cost-effective production of barcoded adapters to tag individual DNA molecules before PCR and sequencing, and better control over cross-contamination between experiments. We validated our approach in a cohort of 24 patients with a broad spectrum of cancer diagnoses by targeting and quantifying single-nucleotide variants (SNVs), indels and genomic rearrangements in plasma samples. By using personalized panels targeting a priori known mutations, we demonstrate comprehensive error-suppression capabilities for SNVs and detection thresholds for ctDNA below 0.1%. We also show that our semi-degenerate barcoded adapters hold promise for noninvasive genotyping in the absence of tumor biopsies and monitoring of minimal residual disease in longitudinal plasma samples. The benefits demonstrated here include broad applicability, flexibility, affordability and reproducibility in the research and clinical settings.


Conflict of interest statement

The authors declare that they have no competing interests.

Figures

Figure 1
Figure 1
Overview of the experimental workflow to track ctDNA in cancer patients using semi-degenerate barcoded adapters and personalized panels of biotinylated baits. Biotinylated baits targeting somatic mutations previously identified via the sequencing of tumor/liquid biopsies and matched normal DNA samples are generated “in-house” or ordered from commercial manufacturers (1). Next, libraries are built using the cfDNA isolated from liquid biopsy specimens (2). End-repaired and A-tailed cfDNA fragments are ligated with partially complementary double-stranded barcoded adapters and then PCR-amplified with 6-nucleotide dual-indexed primers that provide P5 and P7 Illumina adapter sequences. Our custom adapters are comprised of the annealing of two oligonucleotides that harbor non-complementary tri-nucleotide tags for either the plus (5′–3′) or the minus (3′–5′) strand. Different nucleotides within the fixed tags are represented by colours (A:red; C:blue; T:green; G:orange). This adapter design also includes a semi-degenerate and potentially complementary 12-nucleotide barcode sequence ((5′-WSMRWSYWKMWW-3′) in plus strand; (5′-WWKMWRSWYKSW-3′) in minus strand)). During the annealing of the two oligonucleotides a perfect complementary match can occur (right adapter) but, more commonly, hybridizations include annealing mispairings (left adapter). Solid red squares represent either A-T or T-A base pairings (W vs W); solid yellow squares represent either G-C or C-G base pairings (S vs S); solid blue squares represent either C-G or A-T base pairings (M vs K); orange squares represent G-C or A-T (R vs Y); solid green squares represent C-G or T-A base pairings (Y vs R) and solid violet squares represent G-C or T-A base pairings (K vs M). Annealing mispairings (see left adapter) are denoted by the presence of the same base at equivalent positions in both strands. Libraries are then subjected to two rounds (ideally) of hybridization capture using personalized panels of biotinylated baits and final enriched libraries are sequenced on Illumina platforms (3). The bioinformatic analysis of the NGS reads involves the filtering of on-target reads, merging of paired reads with overlapping ends and generation of consensus sequences according to a de-novo assembly approach that allows for a maximum of 1% mismatches and maximum gap size of 1 bp (4). In essence, the two parental strands derived from every single cfDNA molecule generate independent PCR families. Consensus sequences are generated from each PCR family with at least three independent reads. Consensus sequences from independent strand orientations are considered to derive from the same cfDNA molecule if they share the same start/end positions in the reference sequence and if they do not show more than 2 mismatches in the last 6 semi-degenerate barcode positions flanking the ligation site. Duplex sequencing allows correcting any strand-specific errors or variants deriving from DNA damage. After sequencing, solid red squares represent W degenerate positions (i.e. either A or T); solid yellow squares = S; solid blue squares = M; solid orange squares = R; solid green squares = Y; solid violate squares = K). Annealing mismatches are denoted by white squares and indicated by asterisks. Black squares represent discrepancies with respect to the reference sequence. Consensus sequences are finally mapped against the reference sequence (5) and targeted genomic positions are screened for duplex support of ctDNA and its abundance (6) Only variants independently supported by the consensus sequences of both parental strands are considered high-confidence.
Figure 2
Figure 2
(A) Distribution of the number of nucleotide differences between two random unique molecule identifiers (UIDs) attached to one of the parental strands of dsDNA molecules. (B) Distribution of the number of base mispairings or annealing artifacts along the semi-degenerate barcoded region that arise during adapter annealing. (C) Annealing artifacts are less common within the last six nucleotides of each barcode (i.e. those preceding the ligation site). (D) Distribution of base composition (consensus A: red; consensus C: blue; consensus G: yellow; consensus T: green) and frequency of annealing artifacts (black bars) across every position of the 12-nucleotide semi-degenerate barcode of each adapter molecule. Some of the positions show skewed base ratios that can be attributed to the automated mixing method for randomization during manufacturing. Better ratios for certain semi-degenerate sites might be achieved by selecting the hand mixing method (see methods). The frequency of misannealing artifacts decreases towards the ligation site. (E) Distribution of the number of mismatches between two random UIDs when only the last six barcode positions preceding the ligation site are considered. This data was collected from the three library replicates built from patient NB-pt01 plasma. The X axis shows the number of mismatches or mispairings observed between two given barcode sequences (barcodes attached to single strands originating from independent DNA molecules in A and E and barcodes attached to each of the two parental strands of double stranded DNA molecules in (B and C). The Y axis shows the percentage of comparisons with that number of mismatches or base mispairings.
Figure 3
Figure 3
Histogram of PCR family size distribution for five cfDNA libraries built with 12-nucleotide semi-degenerate barcode adapters. The three library replicates for NB-pt01 plasma (R1, R2 and R3) are depicted by different tones of blue. The libraries built from OSS-pt01 and OVC-pt01 (V2) plasmas are indicated by red and green colors, respectively. The X axis reflects different PCR family size categories or bins and the Y axis shows the proportion of each of these categories in a given library. Singletons and consensus sequences generated from just two PCR duplicates are not included in this plot.
Figure 4
Figure 4
Landscape of background errors in two diverse cfDNA libraries (OVC-pt01 (V2), blue bars; OSS-pt01, red bars). Panels A and B list the type of errors that are corrected at the ssDNA or dsDNA consensus phases, respectively. The Y axis shows different types of presumably false variants and the X axis shows the observed frequency for each of these putative artifacts.
Figure 5
Figure 5
Monitoring of ctDNA abundance across longitudinal plasma series drawn from two colorectal cancer patients (CCR-pt029 and CCR-pt049). V1 relates to the plasma sample drawn at the beginning of the therapeutic treatment. Plasma samples collected at V2 and V3 time points show a decrease in ctDNA levels, in agreement with clinical response. The two patients relapsed after several weeks and this fact is consistent with the raise of ctDNA levels observed in the plasma sample collected at V4 time point. The Y axis indicates the variant allele frequency (VAF) of the somatic mutations quantified in plasma. These libraries were constructed with 12-nucletoide semi-degenerate barcoded adapters and enriched with a panel targeting the exons of 128 cancer-related genes.

References

    1. Crowley E, Di Nicolantonio F, Loupakis F, Bardelli A. Liquid biopsy: monitoring cancer-genetics in the blood. Nat Rev Clin Oncol. 2013;10:472–484. doi: 10.1038/nrclinonc.2013.110. - DOI - PubMed
    1. Karachaliou N, Mayo-de-las-Casas C, Molina-Vila MA, Rosell R. Real-time liquid biopsies become a reality in cancer treatment. Ann. Transl. Med. 2015;3 - PMC - PubMed
    1. Esposito A, Criscitiello C, Locatelli M, Milano M, Curigliano G. Liquid biopsies for solid tumors: Understanding tumor heterogeneity and real time monitoring of early resistance to targeted therapies. Pharmacol. Ther. 2016;157:120–124. doi: 10.1016/j.pharmthera.2015.11.007. - DOI - PubMed
    1. Lebofsky R, et al. Circulating tumor DNA as a non-invasive substitute to metastasis biopsy for tumor genotyping and personalized medicine in a prospective trial across all tumor types. Mol. Oncol. 2015;9:783–790. doi: 10.1016/j.molonc.2014.12.003. - DOI - PMC - PubMed
    1. Cree IA. Liquid biopsy for cancer patients: Principles and practice. Pathogenesis. 2015;2:1–4. doi: 10.1016/j.pathog.2015.05.001. - DOI

Publication types

Grants and funding