

pGlyco 2.0 enables precision N-glycoproteomics with comprehensive quality control and one-step mass spectrometry for intact glycopeptide identification
- PMID: 28874712
- PMCID: PMC5585273
- DOI: 10.1038/s41467-017-00535-2
pGlyco 2.0 enables precision N-glycoproteomics with comprehensive quality control and one-step mass spectrometry for intact glycopeptide identification
Abstract
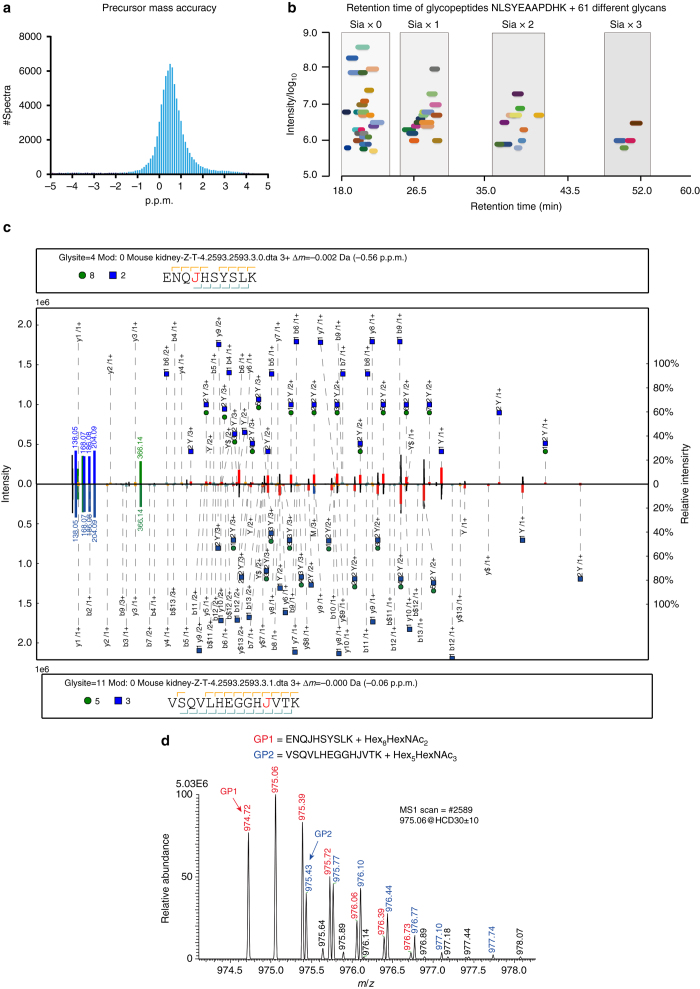
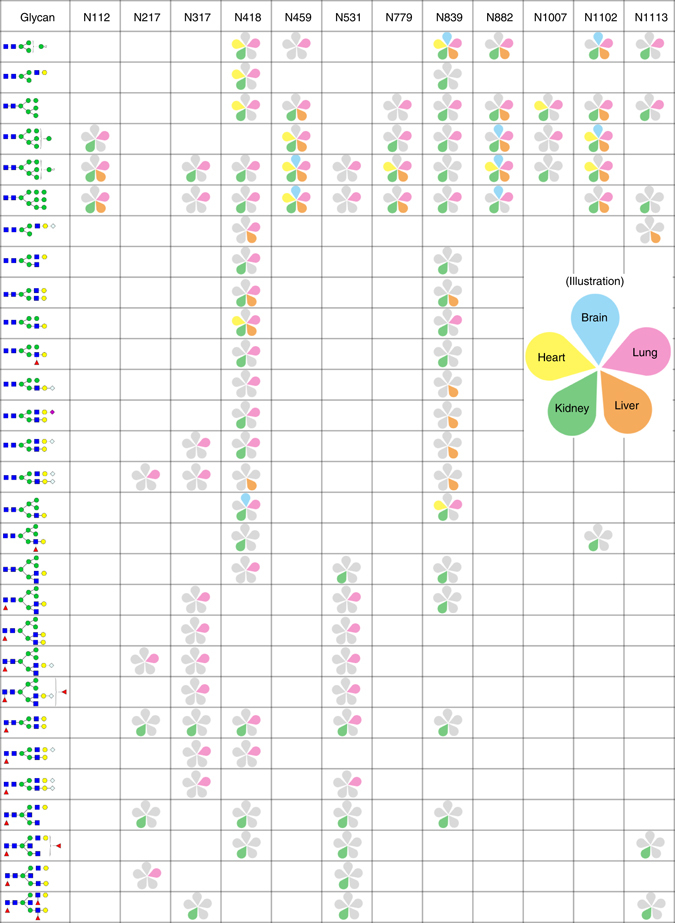
The precise and large-scale identification of intact glycopeptides is a critical step in glycoproteomics. Owing to the complexity of glycosylation, the current overall throughput, data quality and accessibility of intact glycopeptide identification lack behind those in routine proteomic analyses. Here, we propose a workflow for the precise high-throughput identification of intact N-glycopeptides at the proteome scale using stepped-energy fragmentation and a dedicated search engine. pGlyco 2.0 conducts comprehensive quality control including false discovery rate evaluation at all three levels of matches to glycans, peptides and glycopeptides, improving the current level of accuracy of intact glycopeptide identification. The N-glycoproteome of samples metabolically labeled with 15N/13C were analyzed quantitatively and utilized to validate the glycopeptide identification, which could be used as a novel benchmark pipeline to compare different search engines. Finally, we report a large-scale glycoproteome dataset consisting of 10,009 distinct site-specific N-glycans on 1988 glycosylation sites from 955 glycoproteins in five mouse tissues.Protein glycosylation is a heterogeneous post-translational modification that generates greater proteomic diversity that is difficult to analyze. Here the authors describe pGlyco 2.0, a workflow for the precise one step identification of intact N-glycopeptides at the proteome scale.
Conflict of interest statement
The authors declare no competing financial interests.
Figures


Similar articles
-
[Recent advances in glycopeptide enrichment and mass spectrometry data interpretation approaches for glycoproteomics analyses].Se Pu. 2021 Oct;39(10):1045-1054. doi: 10.3724/SP.J.1123.2021.06011. Se Pu. 2021. PMID: 34505426 Free PMC article. Review. Chinese.
-
Site- and structure-specific quantitative N-glycoproteomics study of differential N-glycosylation in MCF-7 cancer cells.J Proteomics. 2020 Feb 10;212:103594. doi: 10.1016/j.jprot.2019.103594. Epub 2019 Nov 20. J Proteomics. 2020. PMID: 31759178
-
GPSeeker Enables Quantitative Structural N-Glycoproteomics for Site- and Structure-Specific Characterization of Differentially Expressed N-Glycosylation in Hepatocellular Carcinoma.J Proteome Res. 2019 Jul 5;18(7):2885-2895. doi: 10.1021/acs.jproteome.9b00191. Epub 2019 Jun 3. J Proteome Res. 2019. PMID: 31117584
-
Toward Automated N-Glycopeptide Identification in Glycoproteomics.J Proteome Res. 2016 Oct 7;15(10):3904-3915. doi: 10.1021/acs.jproteome.6b00438. Epub 2016 Sep 2. J Proteome Res. 2016. PMID: 27519006
-
Mass spectrometry-based structure-specific N-glycoproteomics and biomedical applications.Acta Biochim Biophys Sin (Shanghai). 2024 Aug 8;56(8):1172-1183. doi: 10.3724/abbs.2024133. Acta Biochim Biophys Sin (Shanghai). 2024. PMID: 39118567 Free PMC article. Review.
Cited by
-
Clinical glycoproteomics: methods and diseases.MedComm (2020). 2024 Oct 4;5(10):e760. doi: 10.1002/mco2.760. eCollection 2024 Oct. MedComm (2020). 2024. PMID: 39372389 Free PMC article. Review.
-
Recent Advances in Glycoproteomic Analysis by Mass Spectrometry.Anal Chem. 2020 Jan 7;92(1):267-291. doi: 10.1021/acs.analchem.9b04651. Epub 2019 Nov 4. Anal Chem. 2020. PMID: 31626732 Free PMC article. Review. No abstract available.
-
Characterization of Cell Glycocalyx with Mass Spectrometry Methods.Cells. 2019 Aug 13;8(8):882. doi: 10.3390/cells8080882. Cells. 2019. PMID: 31412618 Free PMC article. Review.
-
A high-speed search engine pLink 2 with systematic evaluation for proteome-scale identification of cross-linked peptides.Nat Commun. 2019 Jul 30;10(1):3404. doi: 10.1038/s41467-019-11337-z. Nat Commun. 2019. PMID: 31363125 Free PMC article.
-
Identifying Sialylation Linkages at the Glycopeptide Level by Glycosyltransferase Labeling Assisted Mass Spectrometry (GLAMS).Anal Chem. 2020 May 5;92(9):6297-6303. doi: 10.1021/acs.analchem.9b05068. Epub 2020 Apr 15. Anal Chem. 2020. PMID: 32271005 Free PMC article.
References
Publication types
MeSH terms
Substances
Grants and funding
LinkOut - more resources
Full Text Sources
Other Literature Sources
Molecular Biology Databases
