. 2017 Sep 5;8(1):352.
doi: 10.1038/s41467-017-00308-x.

Decidualisation and placentation defects are a major cause of age-related reproductive decline

Affiliations

Decidualisation and placentation defects are a major cause of age-related reproductive decline

Laura Woods et al. Nat Commun. .

Abstract

Mammalian reproductive performance declines rapidly with advanced maternal age. This effect is largely attributed to the exponential increase in chromosome segregation errors in the oocyte with age. Yet many pregnancy complications and birth defects that become more frequent in older mothers, in both humans and mice, occur in the absence of karyotypic abnormalities. Here, we report that abnormal embryonic development in aged female mice is associated with severe placentation defects, which result from major deficits in the decidualisation response of the uterine stroma. This problem is rooted in a blunted hormonal responsiveness of the ageing uterus. Importantly, a young uterine environment can restore normal placental as well as embryonic development. Our data highlight the pivotal, albeit under-appreciated, impact of maternal age on uterine adaptability to pregnancy as major contributor to the decline in reproductive success in older females.Advanced maternal age has been associated with lower reproductive success and higher risk of pregnancy complications. Here the authors show that maternal ageing-related embryonic abnormalities in mouse are caused by decidualisation and placentation defects that can be rescued by transferring the embryo from an old to a young uterus.


Conflict of interest statement

The authors declare no competing financial interests.

Figures
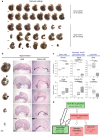
Fig. 1
Fig. 1
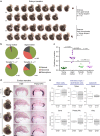
Advanced maternal age impacts on embryonic and placental development. a Gross morphological appearance of E11.5 embryos developed in young (8–12 weeks old) and aged (42–54 weeks old) C57BL/6 females. Each row depicts one entire litter. Scale bars: 1 mm. b Histological analysis by H&E staining and by in situ hybridisation for the trophoblast giant cell marker Prl2c2 (Plf) of placentas associated with conceptuses developed in aged females. The top row depicts a normally developed embryo that is associated with a grossly normal placenta. The four rows below depict embryos with varying degrees of developmental retardation and morphological defects such as a failure of neural tube closure (arrowhead). The placentas associated with these embryos are also defective, insofar as the trophoblast portion is severely under-developed (the dotted line indicates the boundary between the fetal trophoblast compartment and the maternal decidua) or the main direction of placentation is off-centre (arrow). Scale bars: 1 mm. c RT-qPCR analysis of placentas developed in young control (“Y”, n = 3) and aged (“A”) females. Conceptuses developed in aged females were divided into those that appeared grossly normal (“An”; n = 6) or abnormal (“Aa”; n = 6). Markers used represent trophoblast stem cell genes Eomes and Esrrb, markers of the so-called intermediate trophoblast (as found in the ectoplacental cone) or spongiotrophoblast (SpTr) Tpbpa and trophoblast giant cells Prl2c2, and placental labyrinth expressed genes Synb and Ctsq. Data are displayed as mean ± S.E.M. *p < 0.05; **p < 0.01; ***p < 0.001 (ANOVA with Holm-Bonferroni’s post-hoc test). d Diagram of the main trophoblast differentiation defects frequently observed in aged females. Green shading indicates compartments that are relatively over-represented, whereas red shading depicts major differentiation routes that are missing or under-represented. Genes listed in the representative colour support these conclusions
Fig. 2
Fig. 2
Developmental defects are mitigated by transfer of embryos from aged females into young foster mothers. a Litters obtained by embryo transfer from aged to young (A- > Y) recipient females, or from young to young (Y- > Y) females as controls. Note the homogeneity of developmental progression of embryos derived from aged females developing in young females, compared to the litters shown in Fig. 1a. Scale bars: 1 mm. b Pie charts of gross morphological appearance of embryos scored as normal or abnormal, and the number of resorption sites, in the different scenarios. c Crown-rump length measurements as indicator of developmental variability, displayed as coefficient of variation. Each data point represents the coefficient of variation of one entire litter. Please note that litters of embryos recovered from aged females that were allowed to develop in young foster mothers (Transfer A- > Y) are statistically indistinguishable from litters developed in young females (Y). Measurements were taken on E11.5 embryos. Statistical analysis was by ANOVA followed by Tukey’s multiple comparisons post-hoc test. ns=not significant. d Analysis of placental development by histology as in Fig. 1. Placentas appear normal for all embryos assessed. Scale bars: 1 mm. e RT-qPCR analysis of trophoblast markers in placentas of Y- > Y and A- > Y transfer conceptuses. Data are displayed as mean ± S.E.M., n = 3. No differences in expression levels are observed for any of the genes tested (Student’s t test), corroborating that placental development proceeds normally in A- > Y transfer conceptuses
Fig. 3
Fig. 3
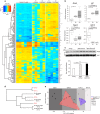
Decidual compartment is abnormal and exhibits hallmarks of developmental delay in conceptuses developed in aged females. a Heatmap of genes commonly de-regulated in the decidual portion of placentas developed in aged females compared to young controls. Please note that the extent of gene de-regulation increases with age of the female (43 vs. 45–47 weeks of age) and is also more pronounced in deciduas associated with abnormal embryos (Aa). Genes selected for display were significantly different between young (Y) and Aa deciduas. b Independent validation of differential gene expression for key decidualisation genes by RT-qPCR. Samples are as in Fig. 1c. Data are displayed as mean ± S.E.M. *p < 0.05; **p < 0.01 (n = 3; ANOVA with Holm-Bonferronis post-hoc test). c Confirmation of higher Bmp2 expression levels in deciduas developed in aged females by Western blot. Quantification of band intensities of three independent biological replicates is shown in the graph below. **p < 0.01 (ANOVA with Holm-Bonferronis post-hoc test). d Closest neighbour analysis of global transcriptomes generated by RNA-seq from E11.5 deciduas from aged females compared to those developed in young females of a developmental time course from E9.5-E12.5 (in red font). Each line represents transcriptomes of 2–9 independent biological replicates (see Supplementary Fig. 4 for all samples), with samples recovered from separate litters in every case. e Principal component analysis of the samples shown in d, showing that the E11.5 deciduas recovered from aged females exhibit an expression signature more closely resembling that of E9.5–10.5 young samples
Fig. 4
Fig. 4
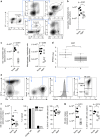
Altered leucocyte composition at the maternal-fetal interface at mid-gestation. a Flow cytometry analysis of decidual leucocytes: gating strategy showing delineation of uterine cells into macrophages and dendritic cells (DCs, pre-gated on live singlets). b Absolute number of leucocytes recovered per implantation site. c Enumeration of macrophages and DCs at the maternal-fetal interface. d Expression levels of Csf1, a key cytokine of DC cell maturation, as determined by RNA-seq, displayed as normalised read counts of 9 (young = Y) and 10 (aged = A) independent replicates. Data are displayed as mean ± S.E.M. ***p < 0.001 (two-tailed t test). e Gating strategy used to identify uNK cells and delineation into tissue-resident CD49a+ and conventional CD49a cells (pre-gated on live singlets). f Enumeration of NK cells per implantation site and relative abundance of tissue-resident and conventional uNK cells, as well as frequency of more mature CD11b+ uNK cells. g Enumeration and maturation phenotype of peripheral splenic NK cells in pregnant females. Each data point in b, c, f and g represents an entire litter of one pregnant mouse, values in f are means ± S.E.M
Fig. 5
Fig. 5
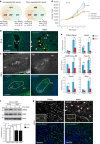
Decidualisation defects are evident in the pre-receptive uterus. a Heatmap of differentially expressed genes in E3.5 uteri of young and aged females that were mated with vasectomised males. Two independent samples per uterus dissected from corresponding regions were assessed per animal, resulting in six sequencing samples from a total of three animals in each age group. b Examples of key regulatory genes in decidualisation that exhibit significantly divergent expression between uteri of young and aged females. Values are normalised for total read counts and displayed as mean ± S.E.M. (n = 3). *p < 0.05; **p < 0.01; ***p < 0.001 (two-tailed t test). c Venn diagrams of genes commonly up-regulated or down-regulated in uteri of aged E3.5 females and in knockouts for Bmp2 and Pgr. d Gene ontology and enrichment analyses of genes differentially up-regulated or down-regulated between E3.5 uteri of young and aged females. e Proliferation assay of isolated uterine stromal cells on 4 consecutive days after plating. Cells from aged females exhibit significant proliferation defects (mean ± S.E.M., n = 4). Two-way ANOVA with Holm-Sidaks multiple comparisons test. f Ki67 staining of E3.5 uteri of young and aged females. Arrows point to luminal epithelium. STR = stromal cell compartment, LE = luminal epithelium. Scale bar: 200 µm
Fig. 6
Fig. 6
Blunted hormone responsiveness in uterine stromal cells of aged females. a Venn diagram of de-regulated genes in deciduas of aged females and their proximity to oestrogen receptor-α (Esr1) and progesterone receptor (Pgr) binding elements. b E3.5 uteri stained for Pgr. White arrows point to the homogenous staining of Pgr in luminal epithelium (LE) of young uteri. Red-lined arrows highlight the mosaic staining of Pgr in LE of aged uteri with large patches exhibiting drastically reduced Pgr levels. Scale bar: 200 µm. c E6.5 implantation sites developed in young and aged females stained for Pgr. Dotted lines demarcate the boundary between the primary (PDZ) and secondary (SDZ) decidualisation zones. In young females, decidualisation has progressed such that Pgr staining is strongest in the SDZ, whereas in aged females staining still highest in the PDZ. Red asterisks demarcate autofluorescence from blood cells. Scale bar: 500 µm. d Proliferation curve of decidual stromal cells isolated from young and aged females either unstimulated or after exposure to the decidualisation-inducing cocktail estrogen (E2), progesterone (P4) and cAMP (mean ± S.E.M., n = 3). Two-way ANOVA with Holm-Sidak’s multiple comparisons test. e RT-qPCR analyses of decidualisation markers in uterine (decidual) stromal cells stimulated for 2 and 4 days (mean ± S.E.M., n = 3). *p < 0.05; **p < 0.01 (pairwise one-tailed t-test). f Western blot for phosphorylated Stat3 (pStat3) in stimulated uterine stromal cells of young and aged females. Graph shows the pStat3/Stat3 ratio normalised to 2 day young cells (mean ± S.E.M., n = 6). *p < 0.05; **p < 0.01 (ANOVA with Holm-Bonferronis post-hoc test). g pStat3 staining of E6.5 implantation sites. Insets show overview photographs of the implantation sites (Emb = embryo, MD = mesometrial decidua), the yellow rectangles demarcate the magnified areas depicted. In young females, pStat3 staining is confined to the nuclei of decidualised stromal cells, indicative of its functionally activated state including as co-activator of Pgr-responsive genes. In aged females, only very few decidual cells exhibit nuclear pStat3 staining (white arrows), whereas in the majority of decidual cells (red-outlined arrows) staining is distinctly excluded from the nucleus. Scale bars: 100 µm

Similar articles

Cited by

References

    1. Martin JA, Hamilton BE, Osterman MJ, Curtin SC, Matthews TJ. Births: final data for 2013. Natl. Vital Stat. Rep. 2015;64:1–65. - PubMed
    1. Johnson JA, Tough S, Society of Obstetricians and Gynaecologists of Canada Delayed child-bearing. J. Obstet. Gynaecol. Can. 2012;34:80–93. doi: 10.1016/S1701-2163(16)35138-6. - DOI - PubMed
    1. Abel EL, Kruger M, Burd L. Effects of maternal and paternal age on Caucasian and Native American preterm births and birth weights. Am. J. Perinatol. 2002;19:49–54. doi: 10.1055/s-2002-20173. - DOI - PubMed
    1. Jolly M, Sebire N, Harris J, Robinson S, Regan L. The risks associated with pregnancy in women aged 35 years or older. Hum. Reprod. 2000;15:2433–2437. doi: 10.1093/humrep/15.11.2433. - DOI - PubMed
    1. Delbaere I, et al. Pregnancy outcome in primiparae of advanced maternal age. Eur. J. Obstet. Gynecol. Reprod. Biol. 2007;135:41–46. doi: 10.1016/j.ejogrb.2006.10.030. - DOI - PubMed

Publication types

MeSH terms