. 2017 Sep 6;6(9):e80.
doi: 10.1038/emi.2017.66.

Surveillance for highly pathogenic influenza A viruses in California during 2014-2015 provides insights into viral evolutionary pathways and the spatiotemporal extent of viruses in the Pacific Americas Flyway

Affiliations

Surveillance for highly pathogenic influenza A viruses in California during 2014-2015 provides insights into viral evolutionary pathways and the spatiotemporal extent of viruses in the Pacific Americas Flyway

Andrew M Ramey et al. Emerg Microbes Infect. .

Abstract

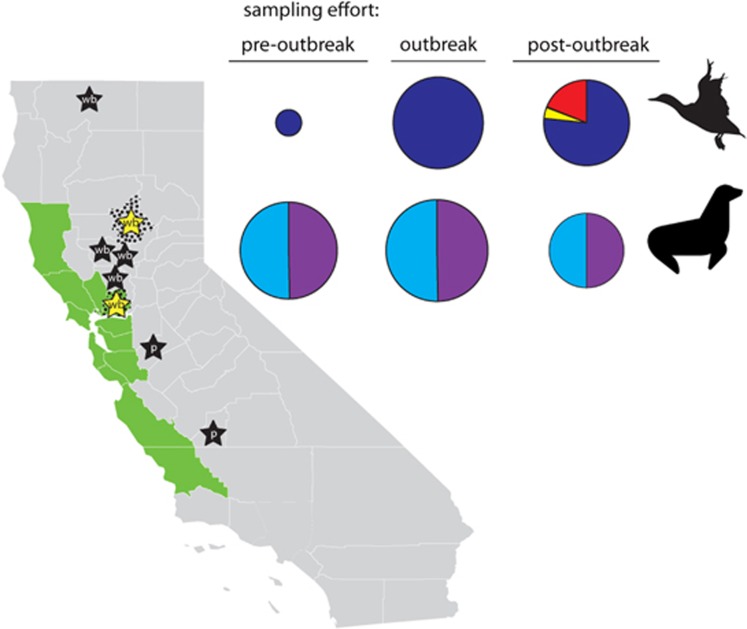
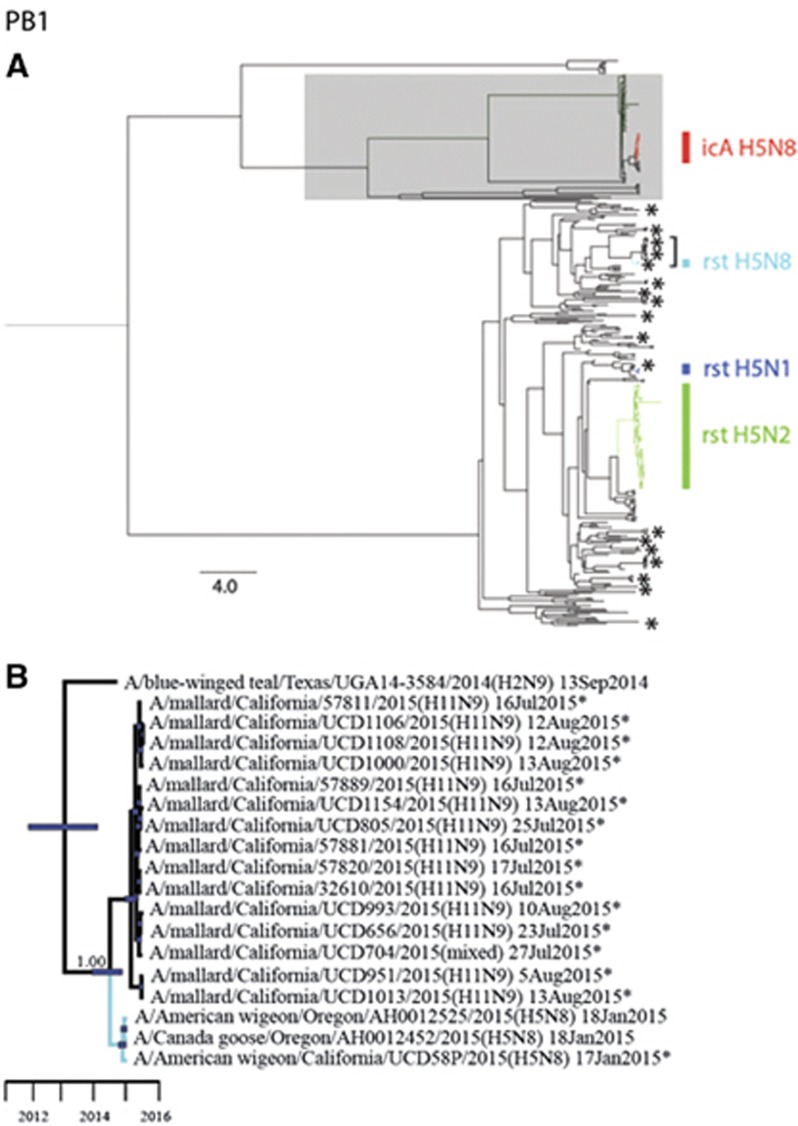
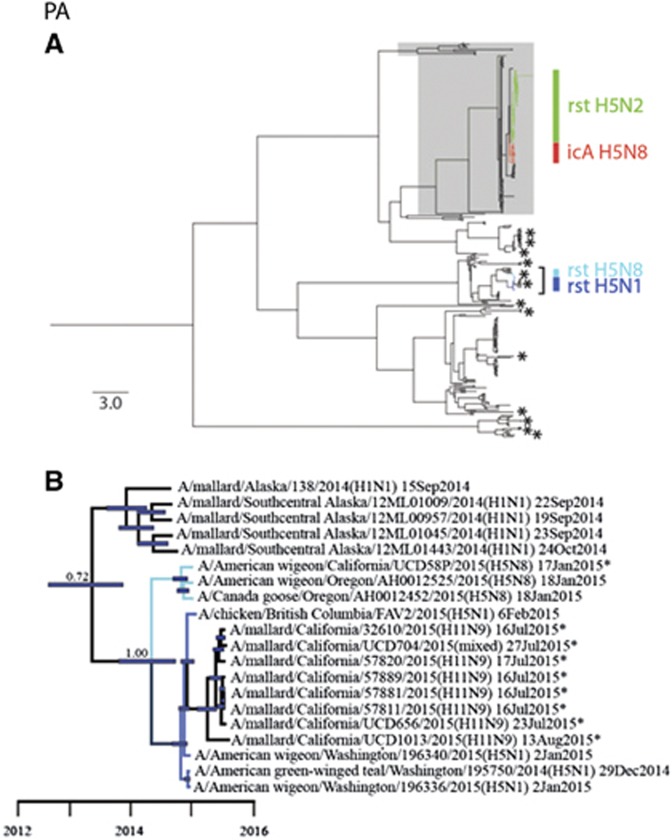
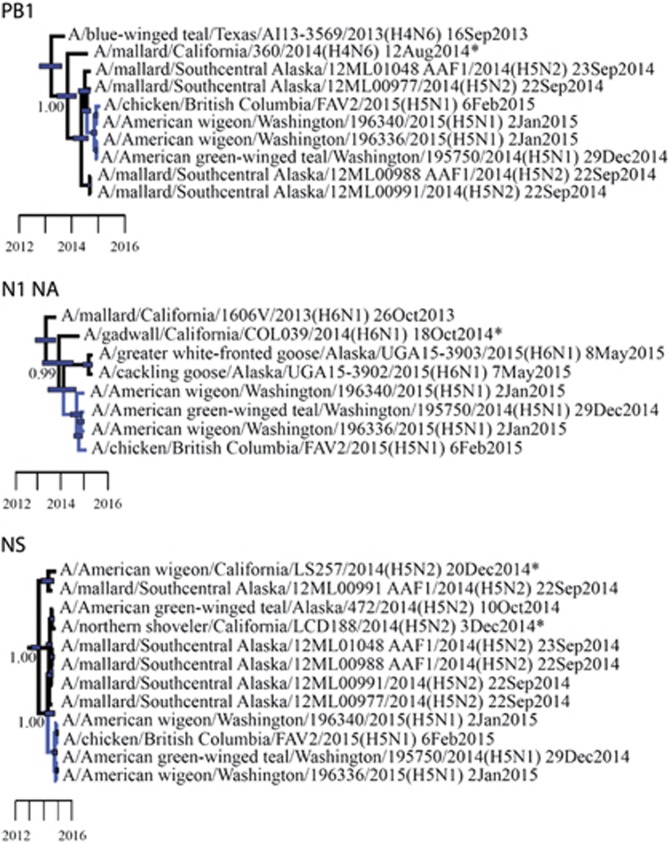
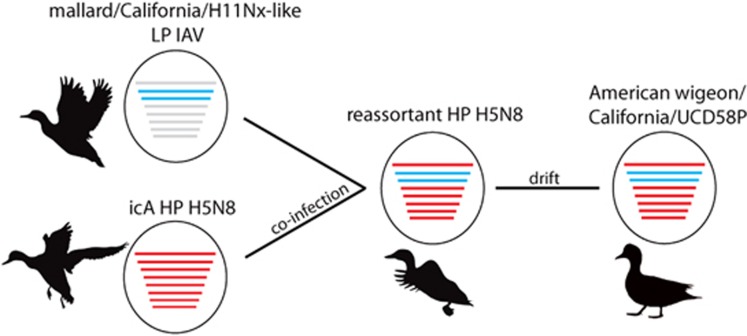
We used surveillance data collected in California before, concurrent with, and subsequent to an outbreak of highly pathogenic (HP) clade 2.3.4.4 influenza A viruses (IAVs) in 2014-2015 to (i) evaluate IAV prevalence in waterfowl, (ii) assess the evidence for spill-over infections in marine mammals and (iii) genetically characterize low-pathogenic (LP) and HP IAVs to refine inference on the spatiotemporal extent of HP genome constellations and to evaluate possible evolutionary pathways. We screened samples from 1496 waterfowl and 1142 marine mammals collected from April 2014 to August 2015 and detected IAV RNA in 159 samples collected from birds (n=157) and pinnipeds (n=2). HP IAV RNA was identified in three samples originating from American wigeon (Anas americana). Genetic sequence data were generated for a clade 2.3.4.4 HP IAV-positive diagnostic sample and 57 LP IAV isolates. Phylogenetic analyses revealed that the HP IAV was a reassortant H5N8 virus with gene segments closely related to LP IAVs detected in mallards (Anas platyrhynchos) sampled in California and other IAVs detected in wild birds sampled within the Pacific Americas Flyway. In addition, our analysis provided support for common ancestry between LP IAVs recovered from waterfowl sampled in California and gene segments of reassortant HP H5N1 IAVs detected in British Columbia, Canada and Washington, USA. Our investigation provides evidence that waterfowl are likely to have played a role in the evolution of reassortant HP IAVs in the Pacific Americas Flyway during 2014-2015, whereas we did not find support for spill-over infections in potential pinniped hosts.


Figures

Figure 1
Figure 1
Map of California depicting locations at which surveillance samples were collected as part of this study. Butte and Solano counties, where samples were collected from wild waterfowl, are indicated with black stippling. The Central California Coast (Mendocino, Sonoma, Marin, Napa, Solano, Contra Costa, Alameda, Santa Clara, San Mateo, San Francisco, Santa Cruz, Monterey and San Luis Obispo counties), where pinnipeds stranded and where samples were collected, is depicted in green. Stars represent approximate county-level locations, where highly pathogenic clade 2.3.4.4 influenza A viruses have been previously detected in California in wild birds (wb: Butte; Colusa; Siskiyou; Solano; Sutter; and Yolo counties) and in poultry (p: Kings; and Stanislaus counties). Yellow stars depict the detection of highly pathogenic clade 2.3.4.4 influenza A viruses from samples that were collected from wild waterfowl sampled in Butte and Solano counties as part of the current study. Pie charts on the right-hand side depict the relative sampling effort (size of pie chart) and proportion of each sample type (cloacal swab=dark blue; fecal swab=yellow; oropharyngeal swab=black; paired oropharyngeal/cloacal swab=red; nasal swab=light blue; and rectal swab=purple) that originated from wild waterfowl and pinnipeds during pre-outbreak (April–August 2014), outbreak (September 2014–March 2015) and post-outbreak (April–August 2015) periods. Map of California courtesy of FreeVectorMaps.com (https://freevectormaps.com/united-states/california/US-CA-EPS-01-0002).
Figure 2
Figure 2
Bayesian phylogenetic tree depicting the inferred genetic relationship among PB1 gene segment sequences for isolates that originated from wild waterfowl in California during the period from 2014 to 2015, highly pathogenic (HP) clade 2.3.4.4 H5 influenza A viruses that were detected in North America during the concurrent outbreak and other reference sequences for wild bird low-pathogenic (LP) influenza A viruses that had been isolated from North America and East Asia. (A) The complete Bayesian phylogeny. Eurasian viral lineages are highlighted in gray. The approximate location of sequences of influenza A virus isolates from wild waterfowl that were sampled in California during 2014–2015 are depicted with asterisks. Asterisks represent more than one closely related sequence in some instances. Branch tips for clade 2.3.4.4 HP H5 influenza A viruses detected in North America are colored-coded and identified as follows: red=intercontinental lineage A HP H5N8 first introduced into North America; light blue=reassortant HP H5N8; dark blue=reassortant HP H5N1; and green=reassortant HP H5N2. The bracket indicates the portion of the phylogeny that is presented in panel B. Inferred evolutionary distance is indicated by the scale bar. (B) A partial PB1 phylogeny to depict inferred genetic ancestry among strain A/American wigeon/California/UCD58P/2015(H5N8), other reassortant HP H5N8 viruses that have been detected in North America and other LP influenza A viruses that were isolated in California as part of this study or elsewhere as part of concurrent surveillance efforts. Color is used to differentiate branch tips for HP reassortant H5N8 viruses (light blue) and LP viruses (black). Asterisks are used to indicate genetic sequences that were produced as part of the current study. Blue bars at nodes depict 95% highest posterior densities, which can be interpreted relative to the provided timescale. The posterior probability for the node depicting inferred common ancestry between reassortant HP H5N8 influenza A viruses and LP viruses detected in mallards sampled in California as part of this study is shown. Refer to Supplementary Figure S2 for the complete phylogenetic tree with tip labels.
Figure 3
Figure 3
Bayesian phylogenetic trees depicting the inferred genetic relationship among PA gene segment sequences for isolates originating from wild waterfowl in California from 2014–2015, highly pathogenic (HP) clade 2.3.4.4 H5 influenza A viruses detected in North America during the concurrent outbreak and other reference sequences for wild bird low-pathogenic (LP) influenza A viruses isolated from North America and East Asia. (A) The complete Bayesian phylogeny. Eurasian viral lineages are highlighted in gray. The approximate location of sequences for influenza A virus isolates from wild waterfowl that were sampled in California during the period from 2014 to 2015 are depicted with asterisks. Asterisks represent more than one closely related sequence in some instances. Branch tips for clade 2.3.4.4 HP H5 influenza A viruses detected in North America are color-coded and identified as follows: red=intercontinental lineage A HP H5N8 that was first introduced into North America; light blue=reassortant HP H5N8; dark blue=reassortant HP H5N1; and green=reassortant HP H5N2. The bracket indicates the portion of the phylogeny that is presented in panel B. Inferred evolutionary distance is indicated by the scale bar. (B) partial PA phylogeny to depict inferred genetic ancestry among strain A/American wigeon/California/UCD58P/2015(H5N8), other reassortant HP H5N1 and H5N8 viruses detected in North America and other LP influenza A viruses that were isolated in California as part of this study or elsewhere as part of concurrent surveillance efforts. Color is used to differentiate among branch tips for HP reassortant H5N1 (dark blue), HP reassortant H5N8 (light blue) and LP influenza A viruses (black). Asterisks are used to indicate genetic sequences produced as part of the current study. Blue bars at nodes depict 95% highest posterior densities, which can be interpreted relative to the provided timescale. The posterior probability of a node that depicts inferred common ancestry between reassortant HP H5N1 and HP H5N8 influenza A viruses with LP viruses detected in mallards sampled in California as part of this study is shown. Refer to Supplementary Figure S3 for the complete phylogenetic tree with tip labels.
Figure 4
Figure 4
Partial Bayesian phylogenetic trees depicting the inferred genetic relationship among PB1, N1 NA and NS gene segment sequences for isolates that originated from wild waterfowl in California from 2014 to 2015 (indicated with asterisks), highly pathogenic (HP) clade 2.3.4.4 H5N1 influenza A viruses detected in North America during the concurrent outbreak and other reference sequences for wild bird low-pathogenic (LP) influenza A viruses isolated from elsewhere in North America as part of previous or concurrent surveillance efforts. Blue bars at nodes depict 95% highest posterior densities, which can be interpreted relative to the provided timescale. The posterior probability for nodes that depict inferred common ancestry among reassortant HP H5N1 influenza A viruses (dark blue branch tips) and LP viruses (black branch tips) detected in wild birds sampled in California as part of this study and previously in Alaska is shown. Refer to Supplementary Figures S2 (PB1), S8 (NS) and S9 (N1) for the complete phylogenetic trees with tip labels.
Figure 5
Figure 5
Proposed evolutionary pathway for influenza A virus strain A/American wigeon/California/UCD58P/2015(H5N8) sequenced as part of this study. Lines representing evolutionary mechanisms are labeled. Silhouettes depict that wild waterfowl were probable hosts for viruses along the proposed evolutionary pathway. The notation ‘mallard/California/H11Nx-like’ refers to an unsampled viral progenitor to H11Nx influenza A viruses that was detected in mallards sampled in California as part of this study sharing common ancestry at the PB1 and PA gene segments with reassortant HP H5N8 viruses. The subtype, host species and location for this progenitor virus are unknown. highly pathogenic, HP; influenza A virus, IAV; intercontinental lineage A clade 2.3.4.4 H5N8, icA; low pathogenic, LP.

Similar articles

Cited by

References

    1. Li KS, Guan Y, Wang J et al. Genesis of a highly pathogenic and potentially pandemic H5N1 influenza virus in eastern Asia. Nature 2004; 430: 209–213. - PubMed
    1. Zhao G, Gu X, Lu X et al. Novel reassortant highly pathogenic H5N2 avian influenza viruses in poultry in China. PLoS One 2012; 7: e46183. - PMC - PubMed
    1. Zhao K, Gu M, Zhong L et al. Characterization of three H5N5 and one H5N8 highly pathogenic avian influenza viruses in China. Vet Microbiol 2013; 163: 351–357. - PubMed
    1. Qi X, Cui L, Yu H et al. Whole-genome sequence of a reassortant H5N6 avian influenza virus isolated from a live poultry market in China, 2013. Genome Announc 2014; 2: e00706–e00714. - PMC - PubMed
    1. Pasick J, Berhane Y, Joseph T et al. Reassortant highly pathogenic influenza A H5N2 virus containing gene segments related to Eurasian H5N8 in British Columbia, Canada, 2014. Sci Rep 2015; 5: 9484. - PMC - PubMed

MeSH terms