. 2017 Sep 5;7(1):10508.
doi: 10.1038/s41598-017-10853-6.

The Schistosoma mansoni genome encodes thousands of long non-coding RNAs predicted to be functional at different parasite life-cycle stages

Affiliations

The Schistosoma mansoni genome encodes thousands of long non-coding RNAs predicted to be functional at different parasite life-cycle stages

Elton J R Vasconcelos et al. Sci Rep. .

Abstract

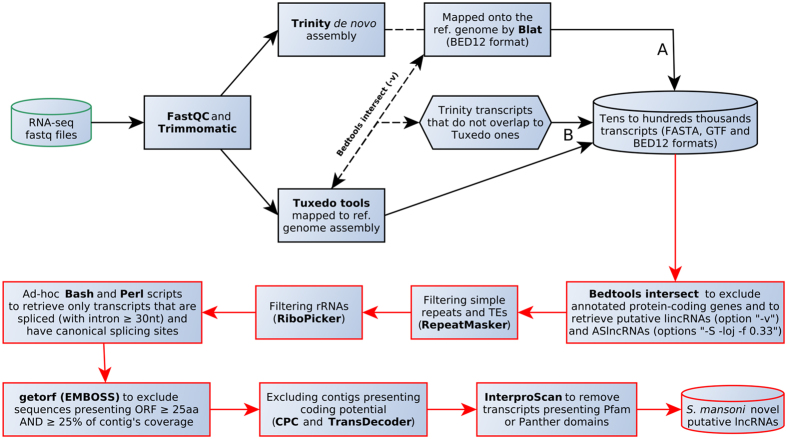
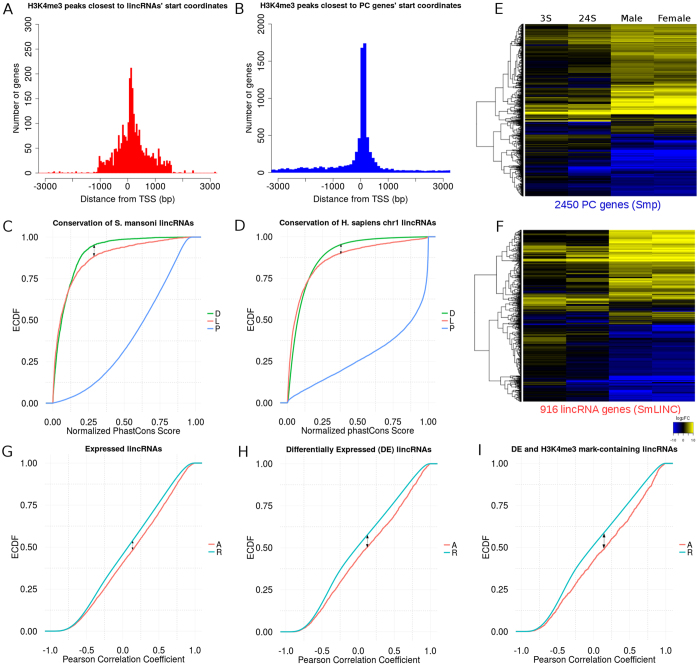
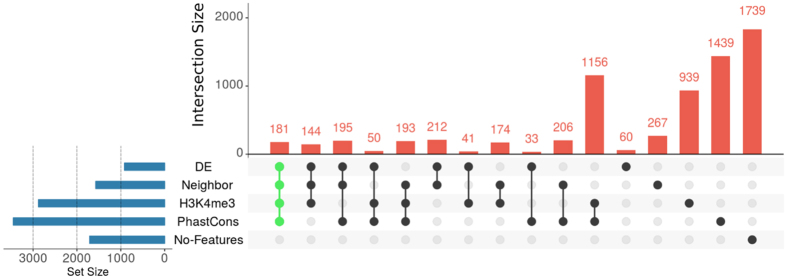
Next Generation Sequencing (NGS) strategies, like RNA-Seq, have revealed the transcription of a wide variety of long non-coding RNAs (lncRNAs) in the genomes of several organisms. In the present work we assessed the lncRNAs complement of Schistosoma mansoni, the blood fluke that causes schistosomiasis, ranked among the most prevalent parasitic diseases worldwide. We focused on the long intergenic/intervening ncRNAs (lincRNAs), hidden within the large amount of information obtained through RNA-Seq in S. mansoni (88 libraries). Our computational pipeline identified 7029 canonically-spliced putative lincRNA genes on 2596 genomic loci (at an average 2.7 isoforms per lincRNA locus), as well as 402 spliced lncRNAs that are antisense to protein-coding (PC) genes. Hundreds of lincRNAs showed traits for being functional, such as the presence of epigenetic marks at their transcription start sites, evolutionary conservation among other schistosome species and differential expression across five different life-cycle stages of the parasite. Real-time qPCR has confirmed the differential life-cycle stage expression of a set of selected lincRNAs. We have built PC gene and lincRNA co-expression networks, unraveling key biological processes where lincRNAs might be involved during parasite development. This is the first report of a large-scale identification and structural annotation of lncRNAs in the S. mansoni genome.


Conflict of interest statement

The authors declare that they have no competing interests.

Figures

Figure 1
Figure 1
Computational workflow for rescuing and identifying novel putative lncRNAs from S. mansoni high-throughput transcriptomic data. Path A depicts the use of a de novo assembly method, whereas path B comprises reference-guided assembly. The red section is built in one single PERL script for the automation of tasks. On the bedtools intersect step (first red rectangle), one can choose whether the pipeline retrieves antisense lncRNAs or lincRNAs.
Figure 2
Figure 2
Novel S. mansoni spliced lncRNA gene loci. All lncRNA isoforms depicted on the figure display both evolutionary conservation (phastCons score) among other schistosome species (S. haematobium and S. japonicum) and epigenetic marks (H3K4me3) that correspond to transcription initiation. (A) LncRNA antisense to a 78 kDa centrosomal protein gene (Smp_140230). The PC genes’ “tail to tail” orientation indicates that the H3K4me3 marks are exclusive to the lncRNA gene. (B) LincRNA locus upstream of a G protein coupled receptor gene (Smp_194740) of which only the last exon is shown. (C) LincRNA loci upstream of a cathepsin L proteinase gene (Smp_187140). (D) LincRNA loci downstream a hypothetical protein gene (Smp_194040). Both protein-coding and lncRNA gene IDs are searchable on the S. mansoni UCSC-like genome browser which our group has deployed (http://schistosoma.usp.br) and previously reported.
Figure 3
Figure 3
S. mansoni lincRNAs display four different traits that may characterize them as functional genes. (A,B) transcriptional activation epigenetic mark (H3K4me3) surrounding the TSS on both lincRNAs (red) and PC genes (blue). (C) An empirical cumulative distribution function (ECDF) showed that lincRNAs’ (red) evolutionary conservation scores (phastCons) among three schistosome species are significantly different from genomic deserts (green) (arrow: one-sided KS-test p-value = 4.25e-06) and from PC genes (blue). (D) As a control, lincRNAs from human chromosome 1 (red) were compared with genomics deserts (green) and with PC genes (blue) from the same chromosome, and they display a phastCons score (comparison among 20 mammals provided by UCSC Table Browser for human genome) ECDF pattern similar to the one observed for S. mansoni (arrow: one-sided KS-test p-value = 2.67e-07). (E,F) Heatmap of 2450 PC genes (E) and 916 lincRNA transcripts (F) that were detected as differentially expressed with one-way ANOVA-like analysis comparing RNA-seq samples from somula 3 h (3S), 24 h (24S) and adults (male and female) against cercariae (the average expression of biological triplicates for each life cycle stage was used, and an adjusted p-value threshold of 0.01 was employed). For each gene (lines), the expression log-ratio between the indicated life cycle stage and cercariae was obtained (columns), and it was colored according to the scale indicated at the bottom of the panel F. (GI) LincRNAs tend to be co-expressed with their PC gene neighbors (A curves, red) rather than with a set of 1000 randomly picked PC genes (R curves, cyan) during parasite development (same five life cycle stages assessed on E and F panels). Pearson correlation values’ ECDF for 1,572 expressed lincRNAs (TPM ≥ 1) that showed either r > 0.5 or r < −0.5 with their actual PC gene neighbors (G), for 893 differentially expressed lincRNAs (TPM ≥ 1) correlated with their actual PC gene neighbors (H) and for 402 DE lincRNAs (TPM ≥ 1) that also have H3K4me3 marks at their TSSs and are correlated with their actual PC gene neighbors (I) (arrows: KS-test p-value < 1e-12 for each of the three distributions).
Figure 4
Figure 4
Hundreds of SmLINCs share two or more traits that may characterize them as functional genes. The UpSet intersection diagram shows the number of lincRNAs that were detected as being differentially expressed across five life cycle stages (DE), as having their expression correlated with the expression of protein-coding gene neighbors (Neighbor), as having histone active transcription marks at their TSSs (H3K4me3) and as being conserved among Schistosoma spp. (PhastCons). The 181 lincRNAs that share all traits were selected for further investigation using systems approaches.
Figure 5
Figure 5
Confirmation by RT-qPCR of the differential expression of selected SmLincRNAs across the parasite life cycle stages. Sixteen SmLincRNAs were selected for validation by RT-qPCR at the parasite stages, namely cercariae (C), schistosomula after 3 hours of mechanical transformation (3S), schistosomula after 24 hours of mechanical transformation (24S), adult male and female (x axis). All sixteen lincRNA loci are among the 181 lincRNAs loci shown at the main intersection in Fig. 4. For each lincRNA plot, the individual sample with the lowest normalized expression value across all stages was chosen and arbitrarily set to 1. The expression values of the same lincRNA for all the other samples are represented as the relative expression compared with the lowest one (y axis). Bars represent standard deviation of the mean from four biological replicates for each stage. Three technical replicates were performed for each of the four biological replicates per stage. The Smp_092920 was used for internal normalization as the reference gene among the parasite stages (see Methods). The ANOVA Tukey test was used to calculate the statistical significance of the expression differences among the parasite forms (*p-value ≤ 0.05; **p-value ≤ 0.01; ***p-value ≤ 0.001; ****p-value ≤ 0.0001). For clarity purposes, it is shown only the highest p-value representation for the stage in which the lincRNA was detected with the highest expression.
Figure 6
Figure 6
Co-expression gene network (lincRNA-PC gene) pinpoints the processes in which lincRNAs may act. (A) The 181 robust lincRNAs (red nodes; lincRNAs from the main intersection in the UpSet Intersection Diagram on Fig. 4) were used as bait for catching 2359 PC genes (blue nodes) whose expression levels across five developmental stages are either positively (r ≥ 0.8, cyan edges) or negatively (r ≤ −0.8, gray edges) correlated with the expression levels of the lincRNAs. The network contains 68,625 edges among which 63,156 (92%) are positive correlations and 5469 (8%) negative ones. (B) A GO gene-enrichment analysis on the PC genes’ list revealed 16 significantly enriched GO terms (−log (p-value) on the x-axis), and among them there were membrane-related terms, as well as retrotransposons activity (orange dashed circles) and GPCR-associated pathways (purple dashed circles). The PC genes from the dash-circled GO categories were manually searched and clustered on the peripheral region from the network in (A), allowing one to see that both positive and negative correlations between lincRNA and PC genes are present on those processes.
Figure 7
Figure 7
Topological filtering step (TFS) approach decreases the number of nodes and improves the visual inspection of lincRNAs’ subclusters. (A) Eighty nine out of the 181 robust lincRNAs from Fig. 4 passed at least one of the two TFS rules: (i) have a PC gene neighbor (Smp) as one of its correlated mates (putative cis-acting mechanism), and (ii) have an in silico computed probability to form a triplex structure (RNA-DNA) on its PC gene mate locus (putative trans-acting mechanism). The “Network Analyzer” function from cytoscape was used in order to obtain betweenness centrality score for each node, meaning the bigger the node, the higher propensity to be a hub. The 22 SmLINCs correlated with multiple PC genes are shown here. The entire network is shown on Supplementary Fig. S3 and it contains 326 nodes (89 SmLINCs and 237 Smps) with 62.5% positively correlated pairs (204/326, r ≥ 0.5, cyan edges) and 37.5% negatively correlated ones (122/326, r ≤ −0.5, gray edges). Dashed edges represent neighbor genes. (B) Gene expression patterns on three subnetworks that were manually selected by highlighting three SmLINC hubs, marked by arrows in (A) and named at the top of each panel in (B). Co-expression kinetics of the SmLINC (red line), positively correlated Smps (dark gray lines) and negatively correlated Smps (light gray lines) expressed across the five life cycle stages: cercariae (cerc), somula 3 h (s3h), somula 24 h (s24h), male and female.

Similar articles

Cited by

References

    1. Mattick, J. S. & Makunin, I. V. Non-coding RNA. Hum Mol Genet15 Spec No 1, R17–29 (2006). - PubMed
    1. Quinn JJ, Chang HY. Unique features of long non-coding RNA biogenesis and function. Nat Rev Genet. 2016;17:47–62. doi: 10.1038/nrg.2015.10. - DOI - PubMed
    1. Khalil AM, et al. Many human large intergenic noncoding RNAs associate with chromatin-modifying complexes and affect gene expression. Proc Natl Acad Sci USA. 2009;106:11667–11672. doi: 10.1073/pnas.0904715106. - DOI - PMC - PubMed
    1. Mercer TR, Mattick JS. Structure and function of long noncoding RNAs in epigenetic regulation. Nat Struct Mol Biol. 2013;20:300–307. doi: 10.1038/nsmb.2480. - DOI - PubMed
    1. Mondal T, Rasmussen M, Pandey GK, Isaksson A, Kanduri C. Characterization of the RNA content of chromatin. Genome Res. 2010;20:899–907. doi: 10.1101/gr.103473.109. - DOI - PMC - PubMed

Publication types