. 2017 Sep 5;7(1):10434.
doi: 10.1038/s41598-017-11059-6.

Oceanographic drivers of the vertical distribution of a highly migratory, endothermic shark

Affiliations

Oceanographic drivers of the vertical distribution of a highly migratory, endothermic shark

Daniel M Coffey et al. Sci Rep. .

Abstract

Salmon sharks Lamna ditropis are highly migratory, upper trophic level predators in North Pacific ecosystems. We analysed a multi-year satellite tag dataset to investigate the habitat use of female salmon sharks across their broad range in the eastern North Pacific (NEP) and identified key environmental factors that influence vertical distribution. Salmon sharks displayed remarkable plasticity in habitat use across disparate oceanographic regions in the NEP and increased utilization of deeper waters in offshore habitats. Diel shifts in vertical distribution and behaviour were consistently observed across their range and likely reflect shifts in their foraging ecology. Salmon sharks utilized a broad thermal niche and exhibited submergence behaviour, possibly for thermal refuge, when encountering sea surface temperatures outside their preferred temperature distribution. Moreover, the vertical distribution of salmon sharks indicates they were able to exploit low dissolved oxygen environments (<1-3 ml l-1), occasionally for extended periods of time in offshore habitats. However, salmon sharks generally reduced their use of deeper waters when encountering the combination of cold temperatures (<6 °C) and low dissolved oxygen concentrations (<1-3 ml l-1). Combining vertical distribution with high-resolution horizontal movements furthers our understanding of the ecological and environmental drivers of movement across short (diel) and long-term (migratory) scales.


Conflict of interest statement

The authors declare that they have no competing interests.

Figures
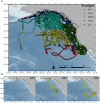
Figure 1
Figure 1
Distribution of tagged salmon sharks in the eastern North Pacific (NEP). (a) Positions of tagged sharks that provided usable data (n = 65) coloured by major ecoregions of the NEP: Alaska Coastal Downwelling (blue), Subarctic Gyre (cyan), North Pacific Transition Zone (yellow), Subtropical Gyre (red) and California Current (green). (b) Individual tracks of three sharks for which PAT tags were recovered (LD51, LD59, LD90). Circles indicate daily mean Bayesian state-space model position estimates and white diamonds indicate pop-up locations of PAT tags. Only positions that overlap temporally with PAT records are shown. Map was created using ArcGIS 10.2 (ESRI Inc., Redland, CA, USA, http://desktop.arcgis.com/en/).
Figure 2
Figure 2
Mean proportion of time spent at depth (TAD) and temperature (TAT) for all sharks aggregated by ecoregion. Histogram error bars represent 95% confidence limits. Total number of sharks (n) and days of histogram data (d) are shown according to each ecoregion and dataset. Mean temperature profiles (red) were constructed from profiles of depth and temperature (PDT) data from the PAT tags. Mean dissolved oxygen profiles (blue) were constructed from monthly data obtained from the World Ocean Atlas 2013 along the track of each shark. Profiles were aggregated by ecoregion across each programmed depth bin. Profile error bars represent ± one standard deviation (s.d).
Figure 3
Figure 3
Estimated mean proportion of time spent at oxygen (TAO) for all sharks aggregated by ecoregion. Total number of sharks (n) and days of histogram data (d) are shown according to each ecoregion. Error bars represent 95% confidence limits.
Figure 4
Figure 4
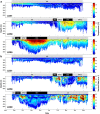
Archival time series of water column thermal structure and vertical displacement rate at depth. (a) Water column thermal structure experienced by sharks overwintering in the Alaska Coastal Downwelling (LD51), migrating to the Subtropical Gyre (LD59), and migrating to the California Current (LD90). Water column thermal structure is color-coded by temperature, and bottom limit denotes daily maximum depth. Note that sharks rarely dove below 600 m, but maximum depth was truncated for clearer illustration. (b) Vertical rate of displacement at depth experienced by sharks; color-coded by vertical rate. Solid lines denote mean depth during night (black) and day (white). Ticks on x-axis denote the start of the month.
Figure 5
Figure 5
Diel patterns in depth, temperature, and vertical displacement rates. (a) Mean proportion of time spent at depth (TAD) and (b) temperature (TAT) by time of day for all recovered archival records aggregated by ecoregion. Plots are color-coded by proportion of time. Proportions greater than 0.25 were truncated for clearer illustration and higher proportions were observed. (c) Mean vertical displacement rate by depth and time of day for all recovered archival records. Plots are color-coded by vertical displacement rate. Values greater than 0.5 m s-1 were truncated for clearer illustration and higher values were observed. Note all eleven sharks (865 total days) with recovered archival records were present in the Alaska Coastal Downwelling (AK); five sharks (212 total days) migrated to the Subarctic Gyre (SAG); two sharks migrated to the North Pacific Transition Zone (NPTZ; 94 total days) and Subtropical Gyre (STG; 107 total days); and one shark (145 total days) migrated to the California Current (CA).
Figure 6
Figure 6
One-week representative depth time series (line) from sharks LD59 and LD90 within the Subtropical Gyre (STG). Background water column thermal structure is color-coded by temperature and night-time is shaded grey. Black and white bars above the time series indicate night and day, respectively.
Figure 7
Figure 7
Daily maximum depths (black lines) ascertained from recovered archival records displayed over World Ocean Atlas 2013 monthly mean dissolved oxygen concentrations extracted for each track position for sharks migrating to the Subtropical Gyre (LD59) and California Current (LD90). Ticks on x-axis denote the start of the month.
Figure 8
Figure 8
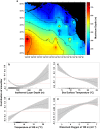
Prediction map and response curves from the final GAMM on daily maximum depth by salmon sharks. (a) Model predictions of daily maximum depth from the final GAMM are averaged in a 1.5° × 1.5° grid and plotted in false colour with numbered contours representative of predicted maximum depth. Cells without data are interpolated using a spring metaphor. Map was created using MATLAB R2015a (The MathWorks Inc., Natick, MA, USA, https://www.mathworks.com/products/matlab.html). (be) Estimated response curves (black solid line) of component smooth functions on daily maximum depth from the final GAMM. Shaded areas represent 95% confidence limits of uncertainty in the centred smooth. Vertical axes are partial responses (estimated, centred smooth functions) on the scale of the linear predictor. Ticks on x-axis denote values for which there are data. Positive values on y-axis (above red dashed line) indicate increased maximum depth.

Similar articles

Cited by

  • Diving into the vertical dimension of elasmobranch movement ecology.
    Andrzejaczek S, Lucas TCD, Goodman MC, Hussey NE, Armstrong AJ, Carlisle A, Coffey DM, Gleiss AC, Huveneers C, Jacoby DMP, Meekan MG, Mourier J, Peel LR, Abrantes K, Afonso AS, Ajemian MJ, Anderson BN, Anderson SD, Araujo G, Armstrong AO, Bach P, Barnett A, Bennett MB, Bezerra NA, Bonfil R, Boustany AM, Bowlby HD, Branco I, Braun CD, Brooks EJ, Brown J, Burke PJ, Butcher P, Castleton M, Chapple TK, Chateau O, Clarke M, Coelho R, Cortes E, Couturier LIE, Cowley PD, Croll DA, Cuevas JM, Curtis TH, Dagorn L, Dale JJ, Daly R, Dewar H, Doherty PD, Domingo A, Dove ADM, Drew M, Dudgeon CL, Duffy CAJ, Elliott RG, Ellis JR, Erdmann MV, Farrugia TJ, Ferreira LC, Ferretti F, Filmalter JD, Finucci B, Fischer C, Fitzpatrick R, Forget F, Forsberg K, Francis MP, Franks BR, Gallagher AJ, Galvan-Magana F, García ML, Gaston TF, Gillanders BM, Gollock MJ, Green JR, Green S, Griffiths CA, Hammerschlag N, Hasan A, Hawkes LA, Hazin F, Heard M, Hearn A, Hedges KJ, Henderson SM, Holdsworth J, Holland KN, Howey LA, Hueter RE, Humphries NE, Hutchinson M, Jaine FRA, Jorgensen SJ, Kanive PE, Labaja J, Lana FO, Lassauce H, Lipscombe RS, Llewellyn F, Macena BCL, Mambrasar R, McAllister JD, McCully Phillips SR,… See abstract for full author list ➔ Andrzejaczek S, et al. Sci Adv. 2022 Aug 19;8(33):eabo1754. doi: 10.1126/sciadv.abo1754. Epub 2022 Aug 19. Sci Adv. 2022. PMID: 35984887 Free PMC article.
  • Extensive oceanic mesopelagic habitat use of a migratory continental shark species.
    Schaber M, Gastauer S, Cisewski B, Hielscher N, Janke M, Peña M, Sakinan S, Thorburn J. Schaber M, et al. Sci Rep. 2022 Feb 7;12(1):2047. doi: 10.1038/s41598-022-05989-z. Sci Rep. 2022. PMID: 35132104 Free PMC article.
  • Novel CTD tag establishes shark fins as ocean observing platforms.
    Pagniello CMLS, Castleton MR, Carlisle AB, Chapple TK, Schallert RJ, Fedak M, Block BA. Pagniello CMLS, et al. Sci Rep. 2024 Jun 15;14(1):13837. doi: 10.1038/s41598-024-63543-5. Sci Rep. 2024. PMID: 38879656 Free PMC article.
  • Climate-driven deoxygenation elevates fishing vulnerability for the ocean's widest ranging shark.
    Vedor M, Queiroz N, Mucientes G, Couto A, Costa ID, Santos AD, Vandeperre F, Fontes J, Afonso P, Rosa R, Humphries NE, Sims DW. Vedor M, et al. Elife. 2021 Jan 19;10:e62508. doi: 10.7554/eLife.62508. Elife. 2021. PMID: 33461659 Free PMC article.
  • Temperature and the vertical movements of oceanic whitetip sharks, Carcharhinus longimanus.
    Andrzejaczek S, Gleiss AC, Jordan LKB, Pattiaratchi CB, Howey LA, Brooks EJ, Meekan MG. Andrzejaczek S, et al. Sci Rep. 2018 May 29;8(1):8351. doi: 10.1038/s41598-018-26485-3. Sci Rep. 2018. PMID: 29844605 Free PMC article.

References

    1. Block BA, et al. Tracking apex marine predator movements in a dynamic ocean. Nature. 2011;475:86–90. doi: 10.1038/nature10082. - DOI - PubMed
    1. Maxwell SM, et al. Dynamic ocean management: defining and conceptualizing real-time management of the ocean. Marine Policy. 2015;58:42–50. doi: 10.1016/j.marpol.2015.03.014. - DOI
    1. Braccini M, Aires-da-Silva A, Taylor I. Incorporating movement in the modelling of shark and ray population dynamics: approaches and management implications. Reviews in Fish Biology and Fisheries. 2015;26:13–24. doi: 10.1007/s11160-015-9406-x. - DOI
    1. Nagasawa K. Predation by salmon sharks (Lamna ditropis) on Pacific salmon (Oncorhynchus spp) in the North Pacific Ocean. North Pacific Anadromous Fish Commission Bulletin. 1998;1:419–433.
    1. Brodeur R, et al. Epipelagic nekton of the North Pacific Subarctic and Transition Zones. Progress in Oceanography. 1999;43:365–397. doi: 10.1016/S0079-6611(99)00013-0. - DOI

Publication types