

A Ligation of the Lacrimal Excretory Duct in Mouse Induces Lacrimal Gland Inflammation with Proliferative Cells
- PMID: 28874911
- PMCID: PMC5569877
- DOI: 10.1155/2017/4923426
A Ligation of the Lacrimal Excretory Duct in Mouse Induces Lacrimal Gland Inflammation with Proliferative Cells
Abstract
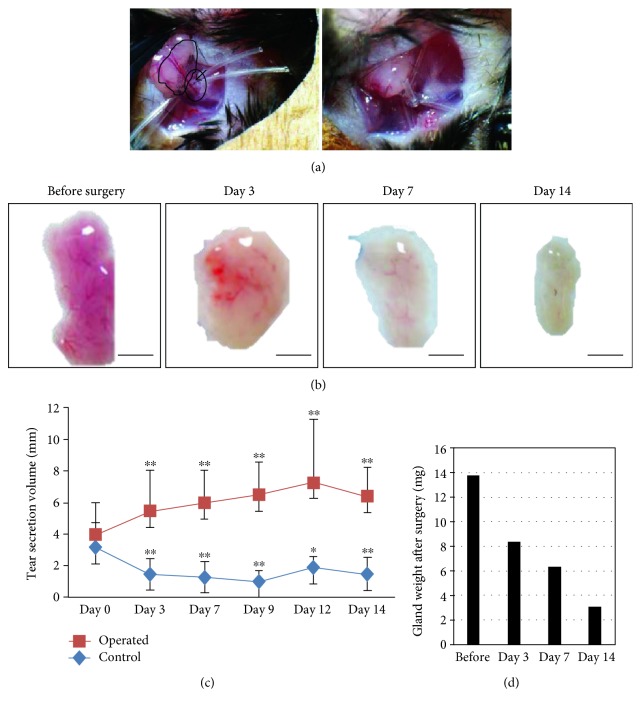
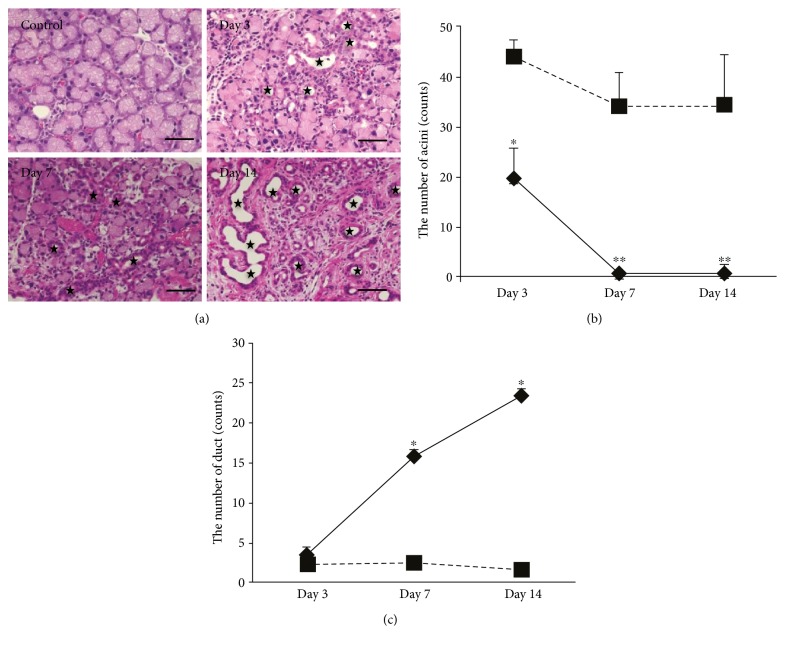
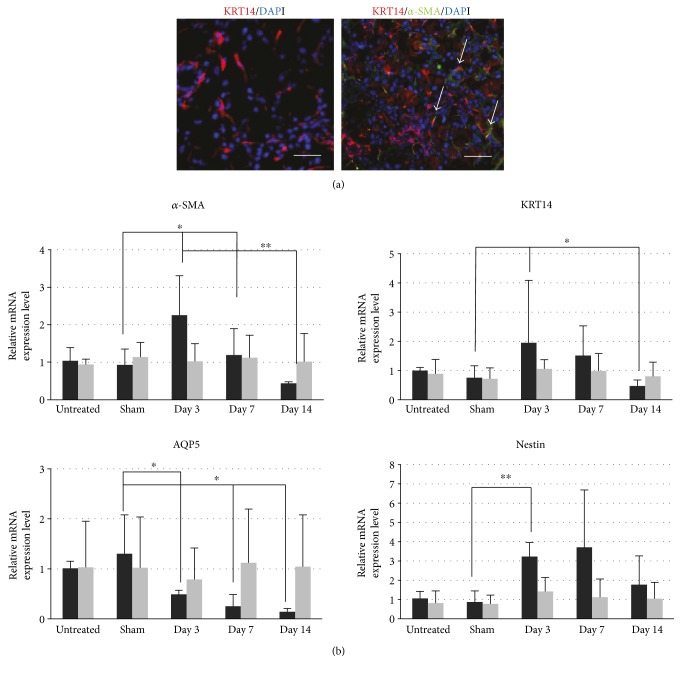
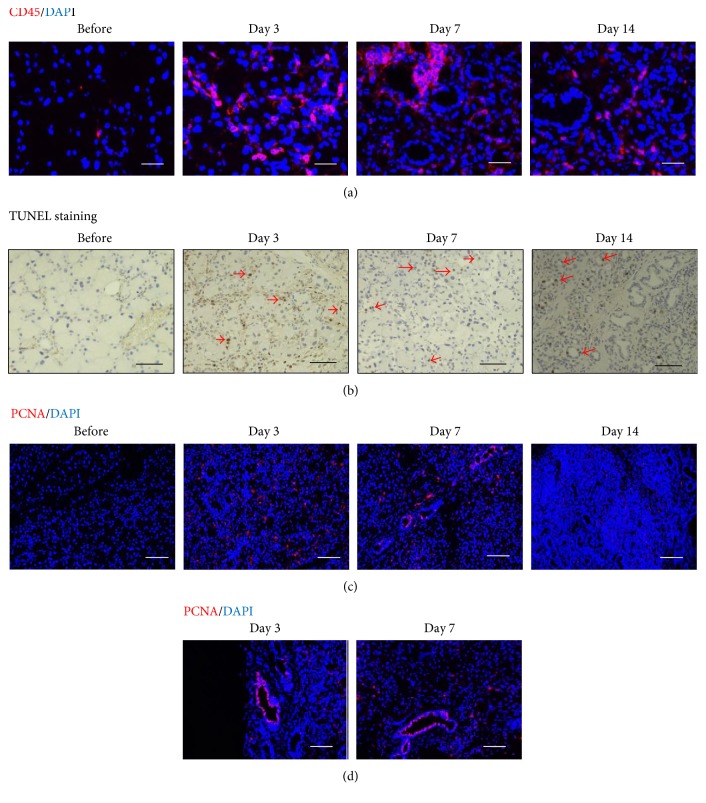
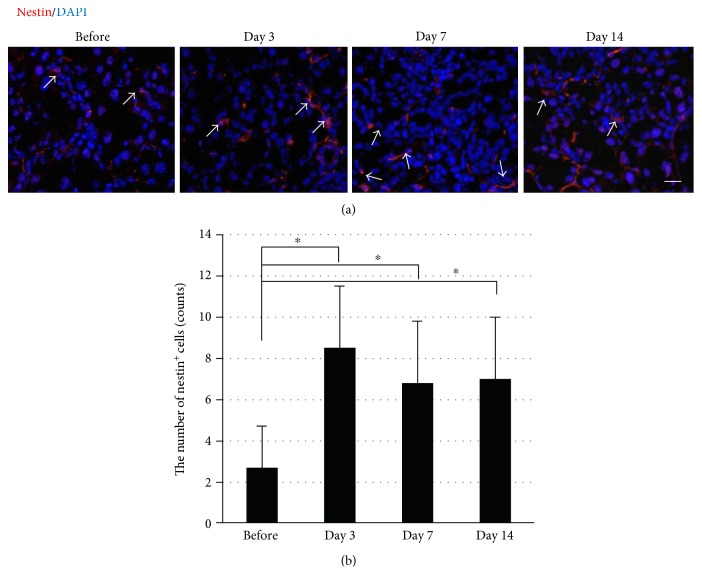
The lacrimal gland secretes tear fluids to ocular surface, which plays an indispensable role in maintaining the health of the ocular epithelia and protecting the ocular surface from the external environment. The dysfunction of the lacrimal glands causes dry eye disease due to a reduction in tear volume. The dry eye disease is becoming a popular public disease, for the number of patients is increasing, who have subjective symptom and loss of vision, which affect the quality of life. Inflammatory change in the damaged lacrimal gland has been reported; however, a major challenge is to establish a simple animal model to observe the changes. Here, we demonstrated an injury model by ligating the main excretory duct of the lacrimal gland, which is a simple and stable way to clearly understand the mechanism of lacrimal gland inflammation. We observed the process of injury and proliferation of the lacrimal gland and detected a population of lacrimal gland epithelial cells with proliferation potential which were also nestin-positive cells following duct ligation. This study successfully established an injury model to observe the tissue injury process of the lacrimal gland, and this model will be useful for analysis of the inflammation and proliferation mechanism in the future.
Figures
Similar articles
-
Preservation of tear film integrity and inhibition of corneal injury by dexamethasone in a rabbit model of lacrimal gland inflammation-induced dry eye.J Ocul Pharmacol Ther. 2005 Apr;21(2):139-48. doi: 10.1089/jop.2005.21.139. J Ocul Pharmacol Ther. 2005. PMID: 15857280
-
Lacrimal Gland Repair after Short-term Obstruction of Excretory Duct in Rabbits.Sci Rep. 2017 Aug 15;7(1):8290. doi: 10.1038/s41598-017-08197-2. Sci Rep. 2017. PMID: 28811503 Free PMC article.
-
Is the main lacrimal gland indispensable? Contributions of the corneal and conjunctival epithelia.Surv Ophthalmol. 2016 Sep-Oct;61(5):616-27. doi: 10.1016/j.survophthal.2016.02.006. Epub 2016 Mar 9. Surv Ophthalmol. 2016. PMID: 26968256 Review.
-
[A new approach for better comprehension of diseases of the ocular surface].J Fr Ophtalmol. 2007 Mar;30(3):239-46. doi: 10.1016/s0181-5512(07)89584-2. J Fr Ophtalmol. 2007. PMID: 17417148 French.
-
Regeneration of Lacrimal Gland Function to Maintain the Health of the Ocular Surface.Invest Ophthalmol Vis Sci. 2018 Nov 1;59(14):DES169-DES173. doi: 10.1167/iovs.17-23576. Invest Ophthalmol Vis Sci. 2018. PMID: 30481823 Review.
Cited by
-
Characterization of dry eye disease in a mouse model by optical coherence tomography and fluorescein staining.Biomed Opt Express. 2019 Aug 28;10(9):4884-4895. doi: 10.1364/BOE.10.004884. eCollection 2019 Sep 1. Biomed Opt Express. 2019. PMID: 31565532 Free PMC article.
-
Exorbital Lacrimal Gland Ablation and Regrafting Induce Inflammation but Not Regeneration or Dry Eye.Int J Mol Sci. 2024 Jul 30;25(15):8318. doi: 10.3390/ijms25158318. Int J Mol Sci. 2024. PMID: 39125889 Free PMC article.
-
MSC Transplantation Improves Lacrimal Gland Regeneration after Surgically Induced Dry Eye Disease in Mice.Sci Rep. 2019 Dec 4;9(1):18299. doi: 10.1038/s41598-019-54840-5. Sci Rep. 2019. PMID: 31797895 Free PMC article.
-
Lacrimal gland homeostasis is maintained by the AQP5 pathway by attenuating endoplasmic reticulum stress inflammation in the lacrimal gland of AQP5 knockout mice.Mol Vis. 2021 Dec 7;27:679-690. eCollection 2021. Mol Vis. 2021. PMID: 35002213 Free PMC article.
-
WNT Mimetic-Induced Lacrimal Gland Regeneration Reverses Aqueous Tear Deficiency.Transl Vis Sci Technol. 2025 Jun 2;14(6):19. doi: 10.1167/tvst.14.6.19. Transl Vis Sci Technol. 2025. PMID: 40492997 Free PMC article.
References
LinkOut - more resources
Full Text Sources
Other Literature Sources
