. 2017 Sep 6:6:e25607.
doi: 10.7554/eLife.25607.

lncRNA requirements for mouse acute myeloid leukemia and normal differentiation

Affiliations

lncRNA requirements for mouse acute myeloid leukemia and normal differentiation

M Joaquina Delás et al. Elife. .

Abstract

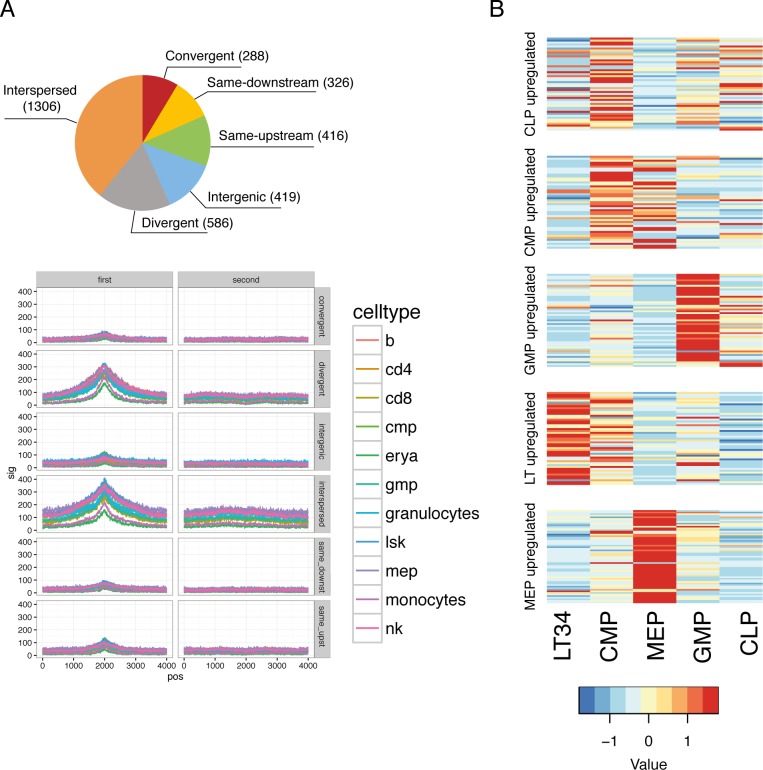
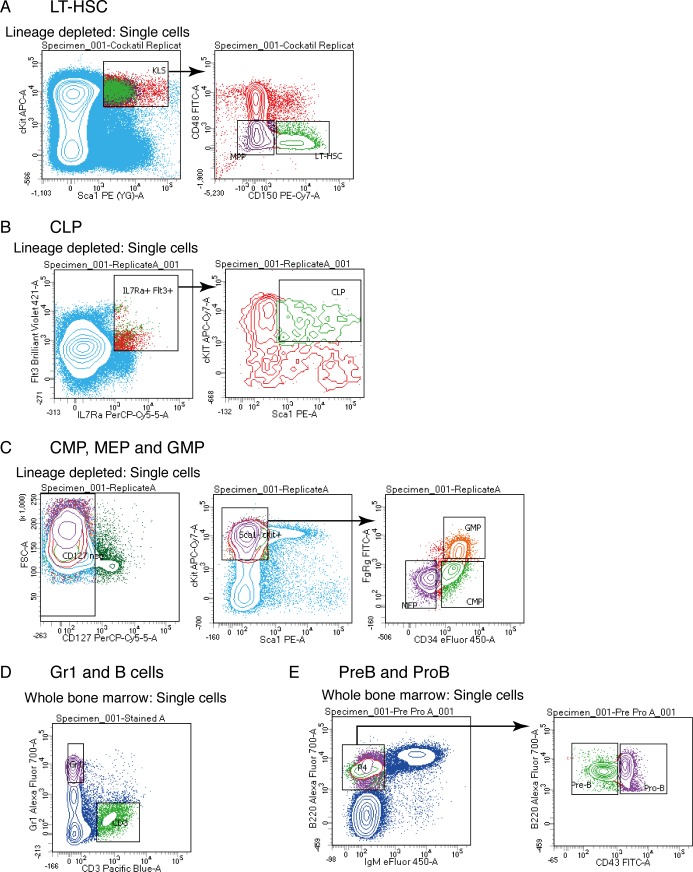
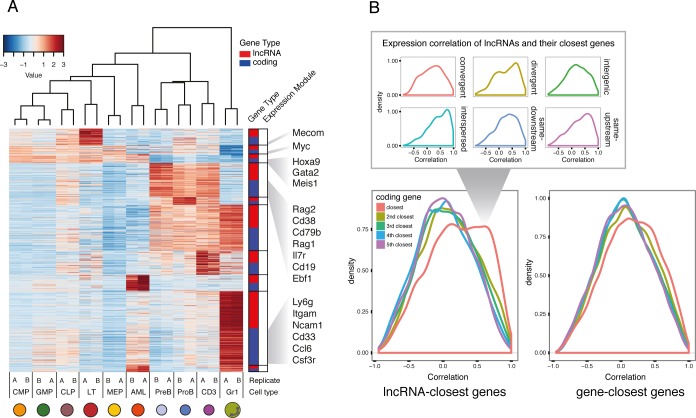
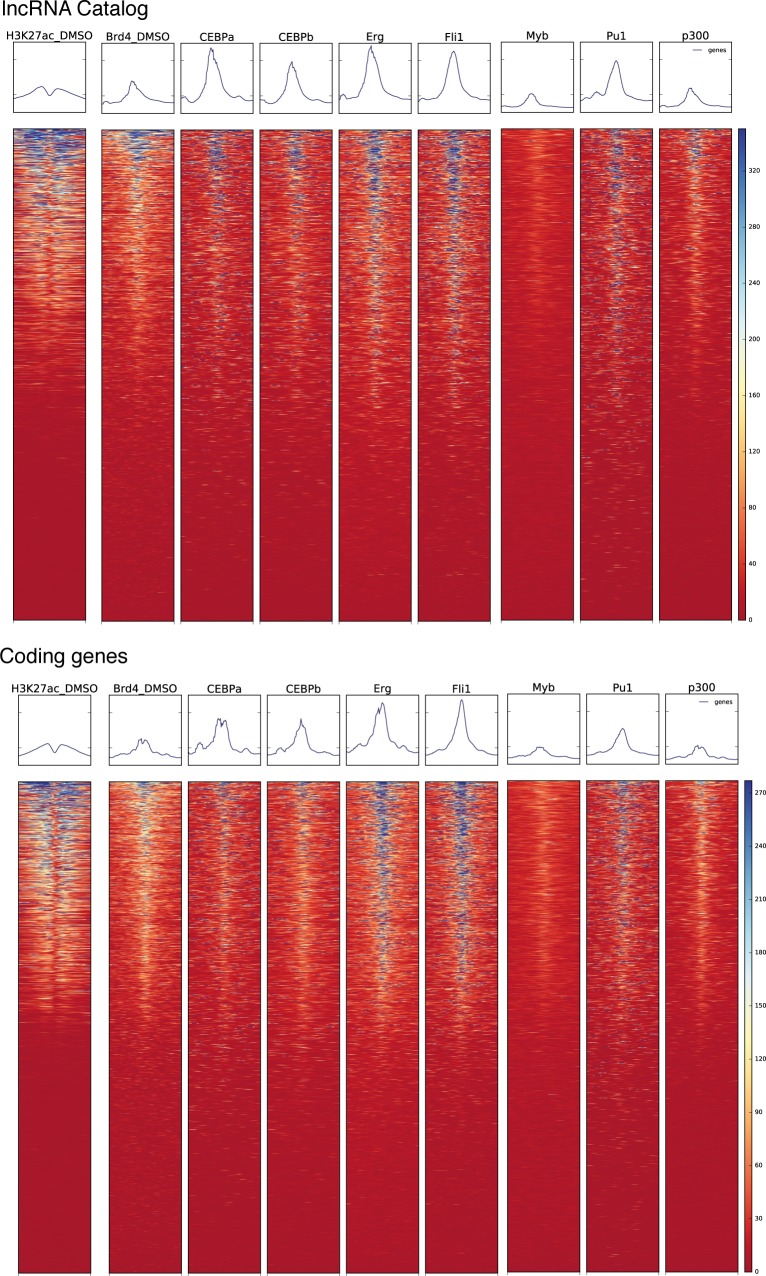
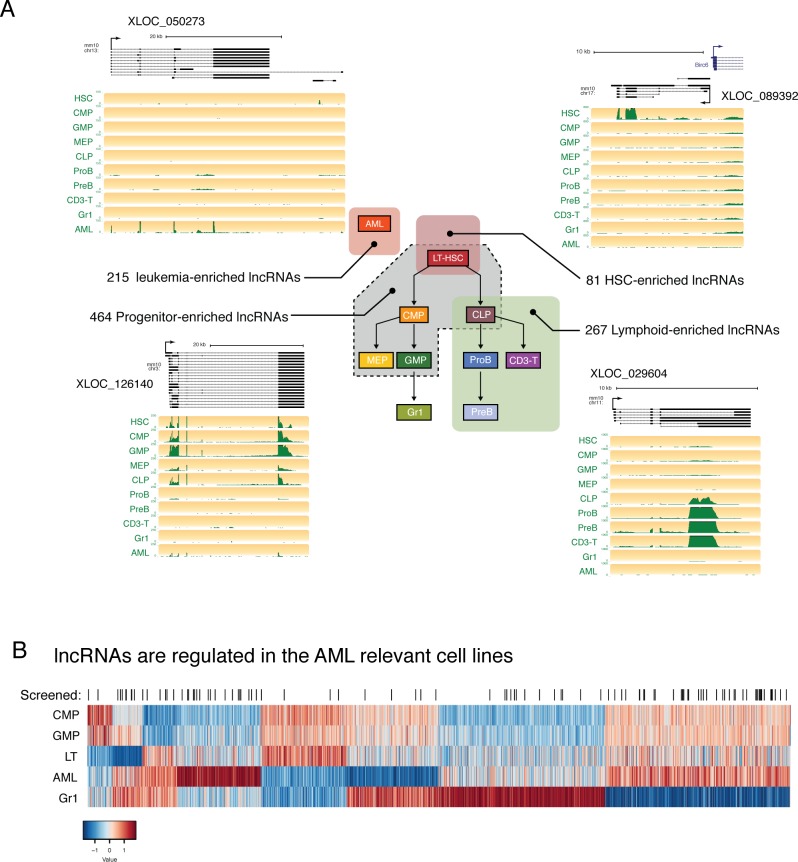
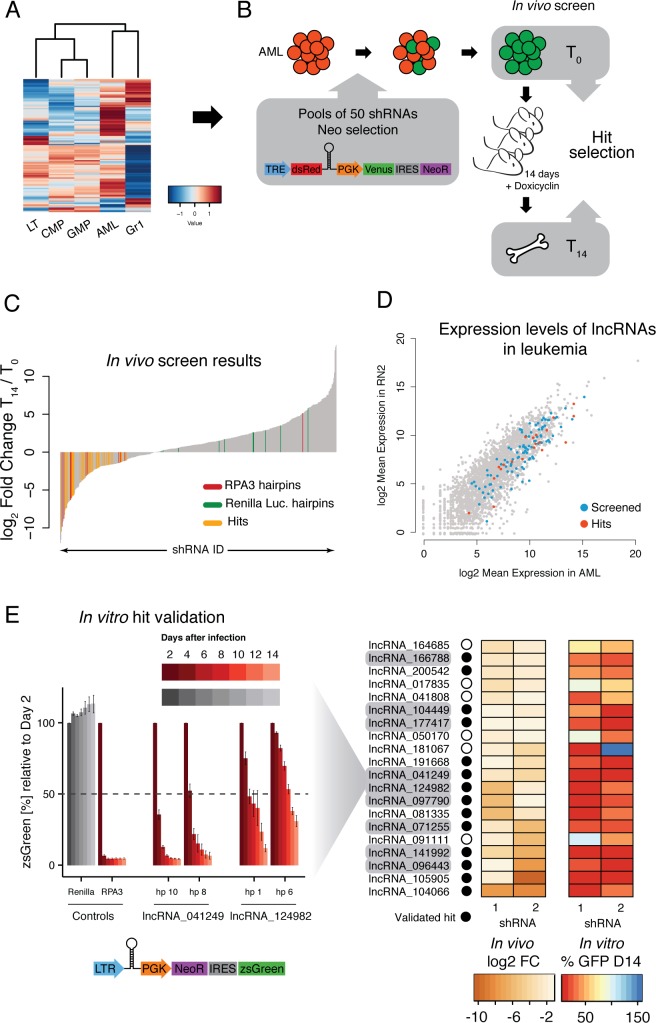
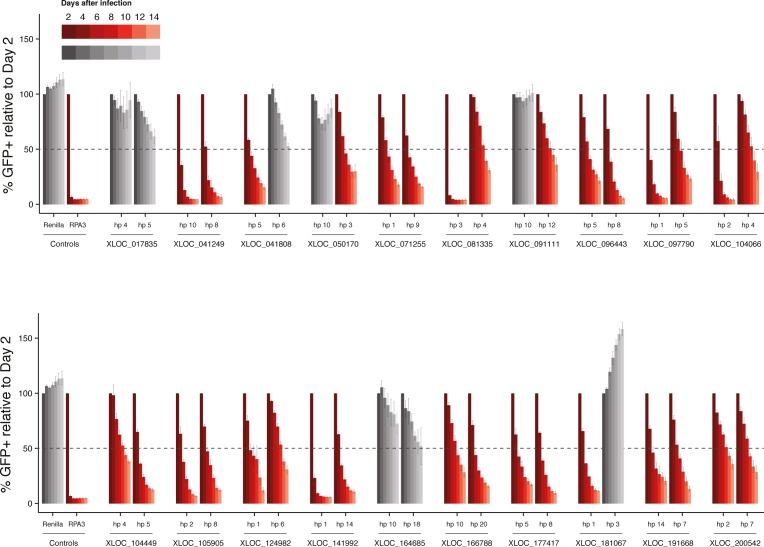
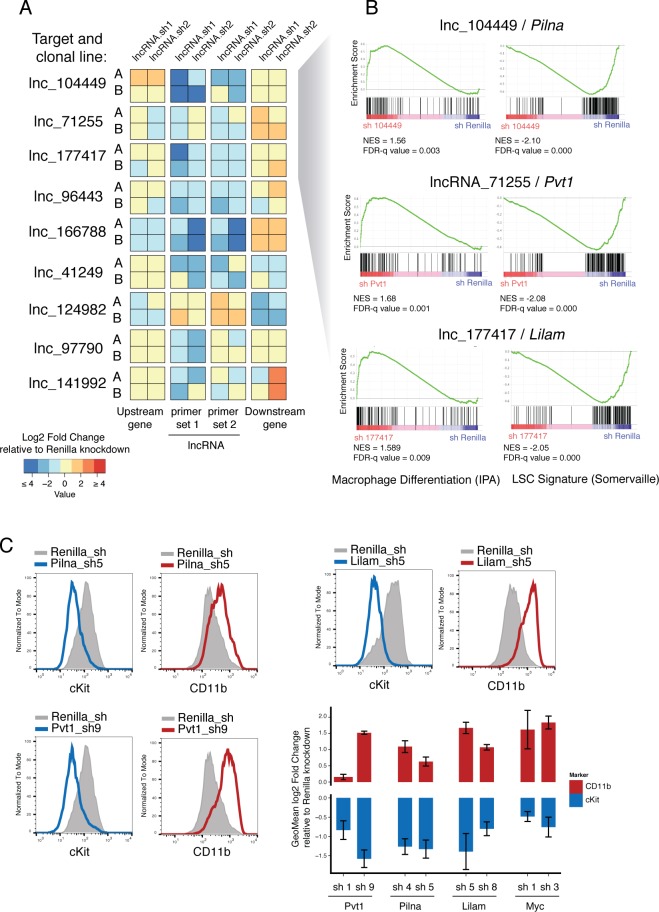
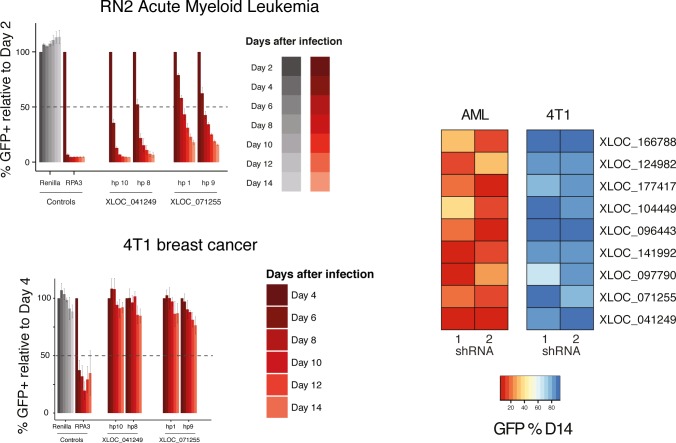
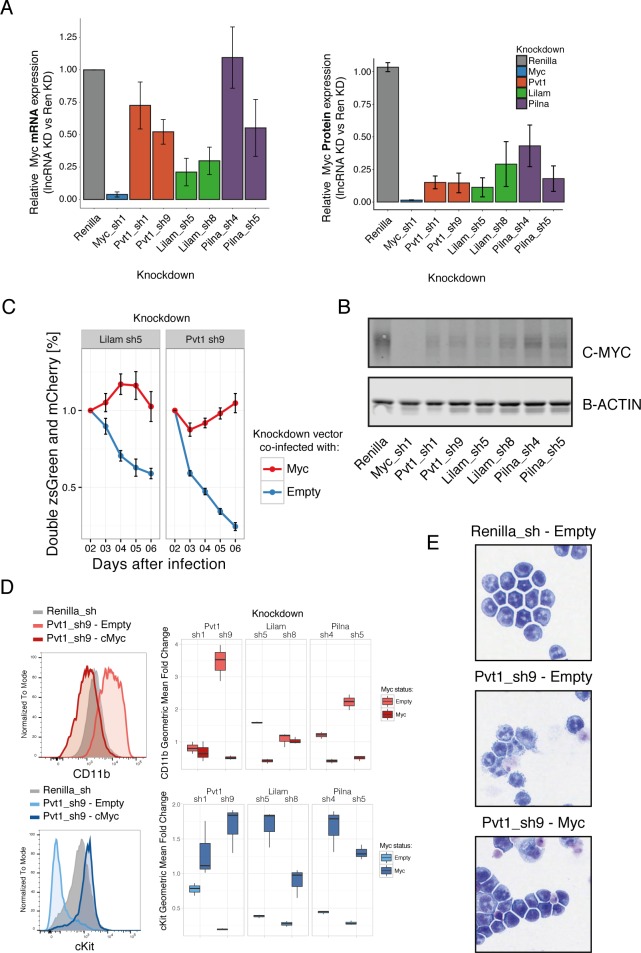
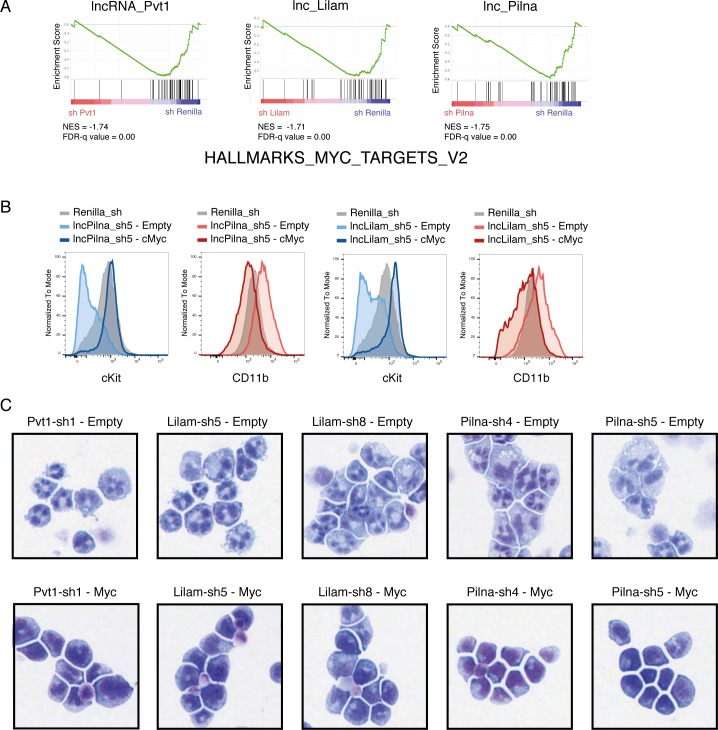
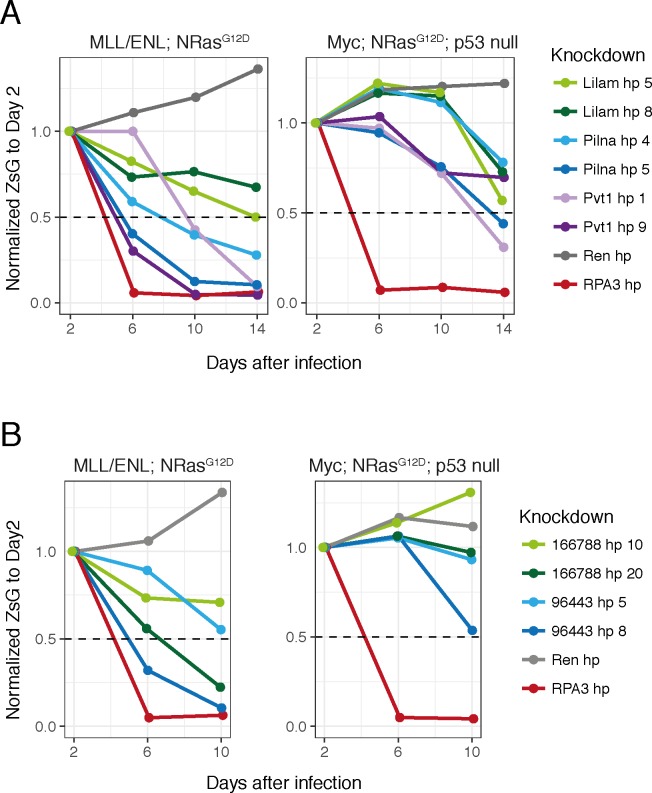
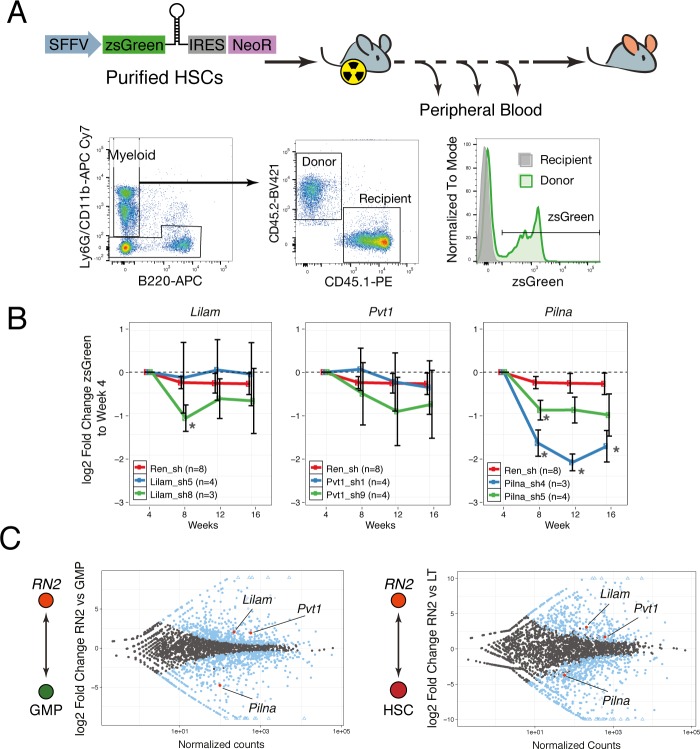
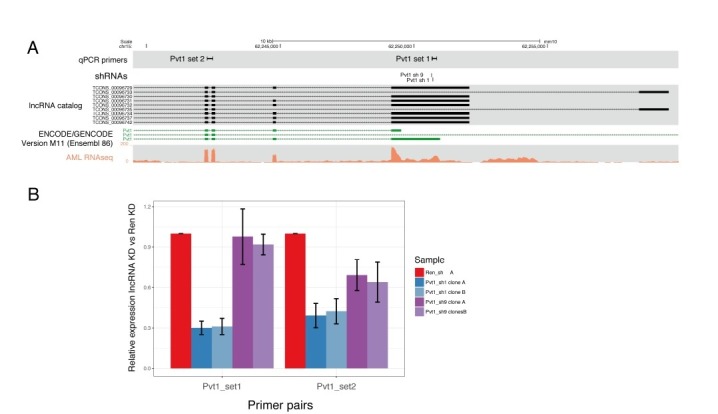
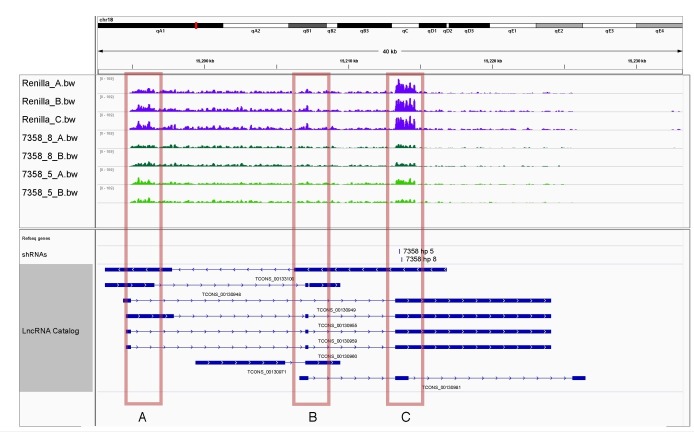
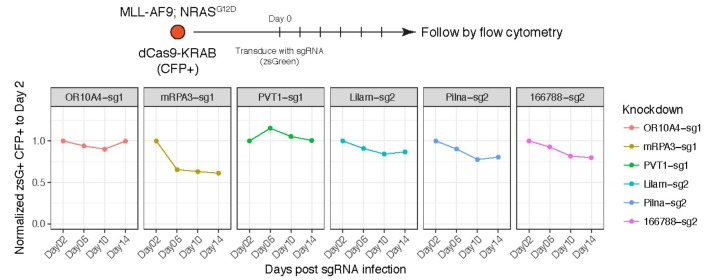
A substantial fraction of the genome is transcribed in a cell-type-specific manner, producing long non-coding RNAs (lncRNAs), rather than protein-coding transcripts. Here, we systematically characterize transcriptional dynamics during hematopoiesis and in hematological malignancies. Our analysis of annotated and de novo assembled lncRNAs showed many are regulated during differentiation and mis-regulated in disease. We assessed lncRNA function via an in vivo RNAi screen in a model of acute myeloid leukemia. This identified several lncRNAs essential for leukemia maintenance, and found that a number act by promoting leukemia stem cell signatures. Leukemia blasts show a myeloid differentiation phenotype when these lncRNAs were depleted, and our data indicates that this effect is mediated via effects on the MYC oncogene. Bone marrow reconstitutions showed that a lncRNA expressed across all progenitors was required for the myeloid lineage, whereas the other leukemia-induced lncRNAs were dispensable in the normal setting.

Keywords: c-Myc; chromosomes; developmental biology; genes; hematopoiesis; leukemia; lncRNA; mouse; stem cells.


Conflict of interest statement

No competing interests declared.

Figures

Figure 1.
Figure 1.. A lncRNA catalog of the murine hematopoietic system.
(A) Schematic of analyzed cell types. Sorting plots can be found in Figure 1—figure supplement 2. (B) Pipeline for assembling the lncRNA catalog. See Materials and methods for full description. (C) Overlap of this study’s lncRNA catalog with previously published non-coding annotations. Overlap is based on coordinates annotation of lncRNA exons. (D) ATAC-seq signal intensity, as a proxy for open chromatin, around the aggregated TSSs of our lncRNA catalog or the aggregated start sites of the second exons for the cell types indicated (ATAC-seq data from [Lara-Astiaso et al., 2014]). (E) Principal component analysis based on the most variable 500 protein coding genes (left) or catalog lncRNA genes (right). Each dot represents a biological replicate.
Figure 1—figure supplement 1.
Figure 1—figure supplement 1.. Validation of catalog transcriptional start sites and sorted progenitor identity.
(A) Pie chart representing the number of lncRNAs that falls in each of the category depending on their relationship with their closest coding gene. ATACseq signal around the TSS for each of those relationships. (B) Expression heat maps for published microarray data (Gazit et al., 2013) is plotted for genes upregulated in the cell types indicated based on our RNAseq data.
Figure 1—figure supplement 2.
Figure 1—figure supplement 2.. Isolation of primary hematopoietic cell types
Flow cytometry sorting plots used to isolate LT-HSC (A), CLP (B), CMP, MEP and GMP (C), Gr1 and B cells (D) and PreB and ProB cells (E) for RNAseq library preparations.
Figure 2.
Figure 2.. Expression profiles of lncRNAs through hematopoietic differentiation resemble broadly the profiles of protein-coding.
(A) Expression data heatmap of the 15% most variable lncRNAs in each co-expression cluster, and the same number of most variable coding genes. Key hematopoietic genes are highlighted. (B) Density plot of correlation of expression for lncRNAs and their fifth closest coding genes. The density of the closest gene is categorized by genomic organization (right). As a comparison, correlation of genes and their closest genes is shown. Interspersed lncRNAs are not included in the main plot.
Figure 2—figure supplement 1.
Figure 2—figure supplement 1.. Regulatory landscape at the TSS of coding genes and lncRNAs.
Heat maps for ChIPseq read density for the indicated histone modifications and transcription factors around the TSS of our lncRNA catalog genes or GENCODE’s coding genes.
Figure 3.
Figure 3.. lncRNAs are differentially regulated through hematopoietic differentiation.
(A) Genome Browser plots showing RNAseq coverage for representative lncRNA gene models in each of the indicated expression profiles along with the corresponding number of differentially expressed genes. (B) Heatmap of expression for lncRNAs differentially regulated between AML and relevant myeloid cell types. lncRNAs included in the in vivo AML screen are highlighted by black lines.
Figure 4.
Figure 4.. An in vivo shRNA screen identifies lncRNAs required for leukemia progression.
(A) Expression profile for the lncRNAs included in the screen. (B) Screen outline: murine MLL-AF9/NRASG12D AML cells were infected at low MOI with retrovirus-encoded pools of 50 shRNAs against candidate lncRNAs. Cells were selected to 100% infection and injected into sub-lethally irradiated mice (3–4 mice per pool, 1 million cells per mice). Hairpin abundance was estimated by high-throughput sequencing of genomic DNA from the initial injection pools and from whole bone marrow 14 days post-injection. (C) Fold change between final and injection time points for each hairpin in the screen. Renilla luciferase and Rpa3 hairpins are highlighted in green and red, respectively. Hairpins of lncRNAs identified as hits are highlighted in yellow. (D) Scatterplot of mean lncRNA expression across two biological replicates in sorted bone marrow AML cells and in vitro culture AML cells. Screened lncRNA and hits are highlighted in blue and red, respectively. (E) One-by-one in vitro competition assay. AML cells were infected with a retrovirus constitutively expressing a single shRNA targeting the indicated lncRNA candidate. The percentage of zsGreen-positive cells relative to day 2 post-infection was followed over the course of 14 days. Bar graphs for controls and two representative lncRNAs (with two hairpins per lncRNA) are shown on the left. Values are the average of four biological replicates; error bars show s.e.m. A summary of the in vivo fold change and the percentage of zsGreen at the latest time point in vitro for all lncRNA hits are shown on the right displayed as a heat map.
Figure 4—figure supplement 1.
Figure 4—figure supplement 1.. Competitive proliferation assays for all the lncRNAs identified as hits in the in vivo screen, with two hairpins per lncRNA.
Percentage of fluorescence cells is normalized to day 2 after infection. Hairpins that produced over 50% depletion are highlighted in red. Values are the mean of four biological replicates, error bars represent s.e.m.
Figure 5.
Figure 5.. Characterization of top validated candidate lncRNAs.
(A) Summary qPCR data shown as log2 fold change expression relative to Renilla Luciferase knockdown. Average values shown as a heatmap from three biological replicates (independent dox inductions) and two independent clonal cell lines. Relative expression was calculated as delta delta Cq using Gapdh as reference. For each lncRNA knockdown (rows), relative expression for the lncRNA itself, and its upstream and downstream genes are shown (columns). (B) Enrichment for Macrophage Differentiation (Ingenuity Pathway Analysis gene set) and Leukemia Stem cell Signature (Krivtsov et al., 2006) gene sets upon lncRNA knockdown was performed using Gene Set Enrichment Analysis. (C) Flow cytometry analysis of cKit and CD11b (Mac-1) surface markers upon lncRNA or Renilla knockdown. A representative plot per lncRNA is shown on the left. Geometric Mean fold change relative to Renilla knockdown is shown as the average of four biological replicates. Error bars represent s.e.m.
Figure 5—figure supplement 1.
Figure 5—figure supplement 1.. Validated lncRNA hits are not generally required for proliferation.
Representative proliferation assays bar plots for AML and breast cancer cell lines (left). Heat map representing normalized depletion by day 14 after infection for the nine lncRNAs that were further analyzed (right).
Figure 6.
Figure 6.. Three ‘leukemia lncRNAs’ affect MYC and enforced expression of this oncogene rescues proliferation and differentiation effects.
(A) Relative MYC mRNA and MYC protein. Values represent the mean across three biological replicates, error bars represent s.e.m. (B) A representative western blot from (A). (C) Percentage of cells co-expressing either a constitutive shRNA vector (zsGreen) and a MSCV-based vector expressing mCherry and either Myc or empty. Data is relative to day 2 after infection. Average values across three replicates shown, error bars represent s.e.m. (D) Immunophenotyping of AML cells expressing either an inducible Renilla shRNA vector, co-expressing lncRNA Pvt1 knockdown and MYC or lncRNA knockdown without MYC (empty). On the right, quantification of the relative expression compared to Renilla is shown as fold change of the geometric mean for each fluorophore. Data obtained from three biological replicates. (E) Wright-Giemsa staining of cytospun cells expressing the indicated inducible shRNA vectors with or without MYC.
Figure 6—figure supplement 1.
Figure 6—figure supplement 1.. Myc target genes are affected by lncRNA knockdown and enforced Myc expression rescues the differentiation phenotype.
(A) GSEA for Myc target genes in lncRNA versus control knockdown transcriptome data. (B) Flow cytometry plots for immunophenotyping of AML cells expressing the indicated knockdowns with or without MYC. (C) Wright-Giemsa staining for cells expressing the indicated constructs.
Figure 6—figure supplement 2.
Figure 6—figure supplement 2.. lncRNA requirements in other AML models.
Proliferation assays in two other AML models for our three most characterized lncRNAs (Lilam, Pilna and Pvt1) (A) and two additional lncRNAs from our validated set (B).
Figure 7.
Figure 7.. lncRNAs Pvt1 and Lilam are miss-regulated in leukemia while Pilna is required for myeloid reconstitution.
(A) Outline of the peripheral blood analysis following bone marrow transplantation. (B) Relative zsGreen percentage to week 4 values. Values of zsGreen represent percentage within donor (CD45.2 +) for the myeloid compartment. Average log2 fold change shown, error bars represent s.e.m. Statistical significance was calculated using the Mann-Whitney/Wilcoxon Rank Sum Test (* p-value<0.05). (C) Relative expression of lncRNAs between leukemia cells (RN2) and two normal progenitor cells types, GMP (left) and LT-HSC (right) versus normalized read counts. Log2 fold change and normalized read counts obtained using DESeq2. Blue dots depict differentially expressed lncRNAs (FDR < 0.05), lncRNAs of interest are highlighted in red.
Author response image 1.
Author response image 1.. (A) Pvt1 genomic organization as predicted by our lncRNA catalog and reported on GENCODE, with the shRNA and primer locations indicated.
A representative transcriptome coverage plot used for de novo transcriptome assembly is shown. (B) qRT-PCR results showing the relative expression of Pvt1 compared to control knockdown (Renilla). Two primer pairs are shown on the X-axis. Knockdown with shRNA 1 are shown in blue and with shRNA 9, in purple.
Author response image 2.
Author response image 2.. Transcriptome coverage for lncRNA_096443 upon control knockdown (Renilla) or knockdown of the lncRNA itself with two independent hairpins, shRNA 5 (light green) and shRNA 8 (dark green).
The predicted isoform structures for this lncRNAs are also shown.
Author response image 3.
Author response image 3.. Proliferation assay for AML cells expressing dCas9-KRAB and sgRNAs targeting the indicated genes/lncRNAs.
Percentage of cells expressing the sgRNA (zsGreen) was monitored over time. Although we made clonal cell line of dCas9-KRAB to ensure they all carry the transgene, we observed silencing of the CFP reporter. For that reason, the gates were set to double positive zsGreen and CFP cells.

References

    1. Alvarez-Dominguez JR, Hu W, Yuan B, Shi J, Park SS, Gromatzky AA, van Oudenaarden A, Lodish HF. Global discovery of erythroid long noncoding RNAs reveals novel regulators of red cell maturation. Blood. 2014;123:570–581. doi: 10.1182/blood-2013-10-530683. - DOI - PMC - PubMed
    1. Anders S, Pyl PT, Huber W. HTSeq--a Python framework to work with high-throughput sequencing data. Bioinformatics. 2015;31:166–169. doi: 10.1093/bioinformatics/btu638. - DOI - PMC - PubMed
    1. Atianand MK, Hu W, Satpathy AT, Shen Y, Ricci EP, Alvarez-Dominguez JR, Bhatta A, Schattgen SA, McGowan JD, Blin J, Braun JE, Gandhi P, Moore MJ, Chang HY, Lodish HF, Caffrey DR, Fitzgerald KA. A Long noncoding RNA lincRNA-EPS acts as a transcriptional brake to restrain Inflammation. Cell. 2016;165:1672–1685. doi: 10.1016/j.cell.2016.05.075. - DOI - PMC - PubMed
    1. Cabezas-Wallscheid N, Klimmeck D, Hansson J, Lipka DB, Reyes A, Wang Q, Weichenhan D, Lier A, von Paleske L, Renders S, Wünsche P, Zeisberger P, Brocks D, Gu L, Herrmann C, Haas S, Essers MA, Brors B, Eils R, Huber W, Milsom MD, Plass C, Krijgsveld J, Trumpp A. Identification of regulatory networks in HSCs and their immediate progeny via integrated proteome, transcriptome, and DNA methylome analysis. Cell Stem Cell. 2014;15:507–522. doi: 10.1016/j.stem.2014.07.005. - DOI - PubMed
    1. Casero D, Sandoval S, Seet CS, Scholes J, Zhu Y, Ha VL, Luong A, Parekh C, Crooks GM. Long non-coding RNA profiling of human lymphoid progenitor cells reveals transcriptional divergence of B cell and T cell lineages. Nature Immunology. 2015;16:1282–1291. doi: 10.1038/ni.3299. - DOI - PMC - PubMed

Publication types

Substances