

Programmed cell death-1, PD-1, is dysregulated in T cells from children with new onset type 1 diabetes
- PMID: 28877189
- PMCID: PMC5587274
- DOI: 10.1371/journal.pone.0183887
Programmed cell death-1, PD-1, is dysregulated in T cells from children with new onset type 1 diabetes
Abstract
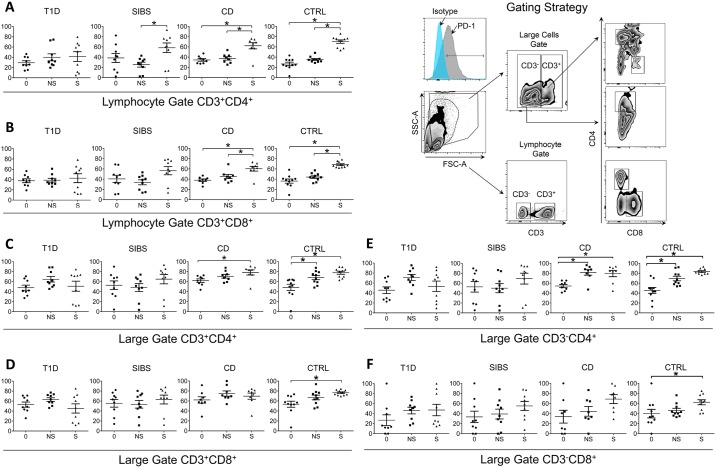
Background: Programmed death cell 1 (PD-1) is an inhibitor of T cell activation and is also functionally linked to glycolysis. We hypothesized that PD-1 expression is defective in activated T cells from children with type 1 diabetes (T1D), resulting in abnormal T cell glucose metabolism.
Methods: In this pilot study, we enrolled children with new onset T1D within 2 weeks of diagnosis (T1D), unaffected siblings of T1D (SIBS), unaffected, unrelated children (CTRL), children with new onset, and untreated Crohn disease (CD). We repeated the assays 4-6 months post-diagnosis in T1D (T1D follow up). We analyzed anti-CD3/-CD28-stimulated peripheral blood mononuclear cells (PBMC) subsets for PD-1 expression by flow cytometry at baseline and after 24 h in culture. We measured cytokines in the culture medium by multiplex ELISA and glycolytic capacity with a flux analyzer.
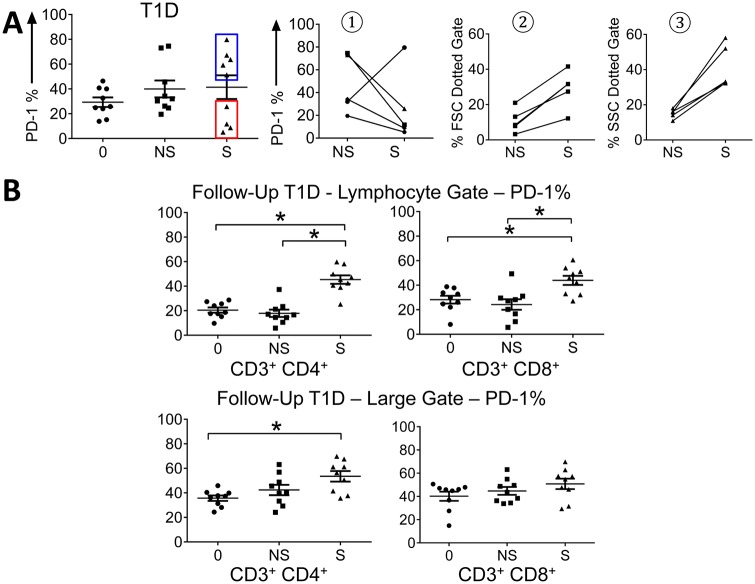
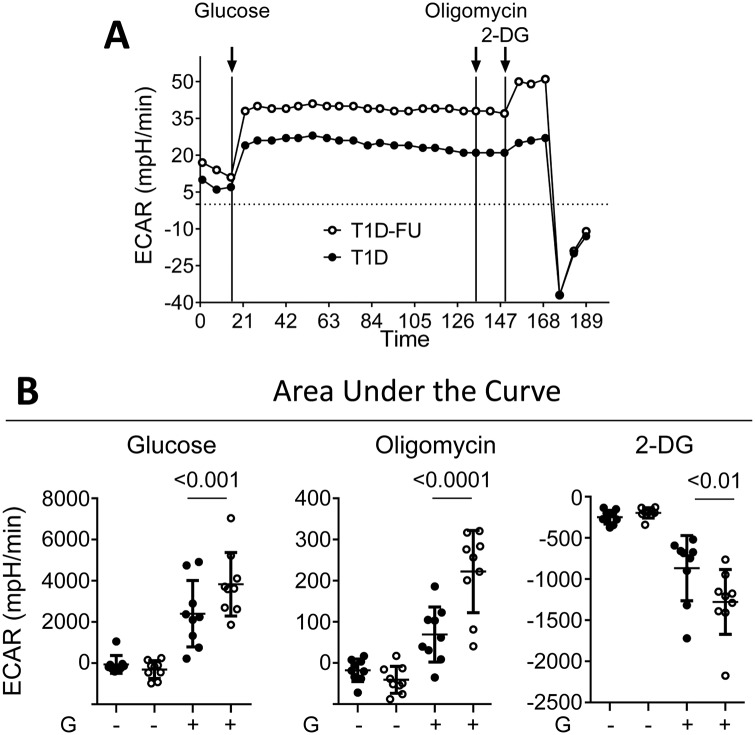
Results: We enrolled 37 children. T cells derived from subjects with T1D had decreased PD-1 expression compared to the other study groups. However, in T1D follow-up T cells expressed PD-1 similarly to controls, but had no differences in PBMC cytokine production. Nonetheless, T1D follow up PBMCs had enhanced glycolytic capacity compared to T1D.
Conclusions: Activated T cells from T1D fail to upregulate PD-1 upon T-cell receptor stimulation, which may contribute to the pathogenesis of T1D. T1D follow up PBMC expression of PD-1 normalizes, together with a significant increase in glycolysis compared to T1D. Thus, insulin therapy in T1D children is associated with normal PD1 expression and heightened glycolytic capacity in PBMC.
Conflict of interest statement
Figures

References
-
- Zoka A, Muzes G, Somogyi A, Varga T, Szeman B, Al-Aissa Z et al. Altered immune regulation in type 1 diabetes. Clin Dev Immunol 2013;2013:254874 doi: 10.1155/2013/254874 - DOI - PMC - PubMed
-
- Ceeraz S, Nowak EC, Noelle RJ. B7 family checkpoint regulators in immune regulation and disease. Trends Immunol 2013. November;34(11):556–563. doi: 10.1016/j.it.2013.07.003 - DOI - PMC - PubMed
-
- Dai S, Jia R, Zhang X, Fang Q, Huang L. The PD-1/PD-Ls pathway and autoimmune diseases. Cell Immunol 2014. July;290(1):72–79. doi: 10.1016/j.cellimm.2014.05.006 - DOI - PubMed
-
- Brown JA, Dorfman DM, Ma FR, Sullivan EL, Munoz O, Wood CR, et al. Blockade of programmed death-1 ligands on dendritic cells enhances T cell activation and cytokine production. J Immunol 2003. February 1;170(3):1257–1266. - PubMed
MeSH terms
Substances
LinkOut - more resources
Full Text Sources
Other Literature Sources
Medical
