

Absence of Sigma 1 Receptor Accelerates Photoreceptor Cell Death in a Murine Model of Retinitis Pigmentosa
- PMID: 28877319
- PMCID: PMC5586962
- DOI: 10.1167/iovs.17-21947
Absence of Sigma 1 Receptor Accelerates Photoreceptor Cell Death in a Murine Model of Retinitis Pigmentosa
Abstract
Purpose: Sigma 1 Receptor (Sig1R) is a novel therapeutic target in neurodegenerative diseases, including retinal disease. Sig1R-/- mice have late-onset retinal degeneration with ganglion cell loss that worsens under stress. Whether Sig1R plays a role in maintaining other retinal neurons is unknown, but was investigated here using rd10 mice, a model of severe photoreceptor degeneration.
Methods: Wild-type, rd10, and rd10/Sig1R-/- mice were subjected to ERG and spectral-domain optical coherence tomography (SD-OCT) to assess visual function/structure in situ. Retinas imaged microscopically were subjected to morphometric analysis, immunodetection of cones, and analysis of gliosis. Oxidative and endoplasmic reticulum (ER) stress was evaluated at mRNA/protein levels.
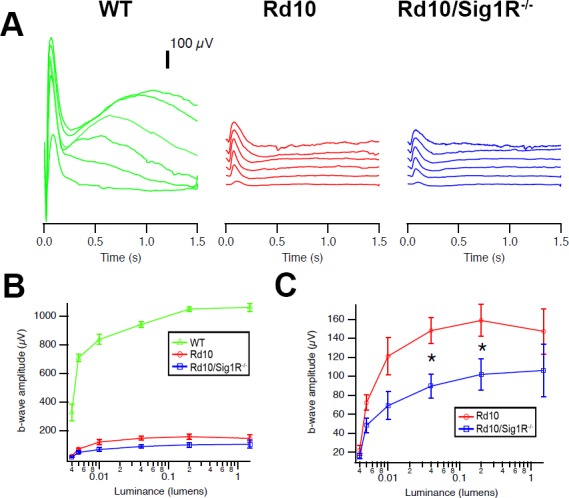
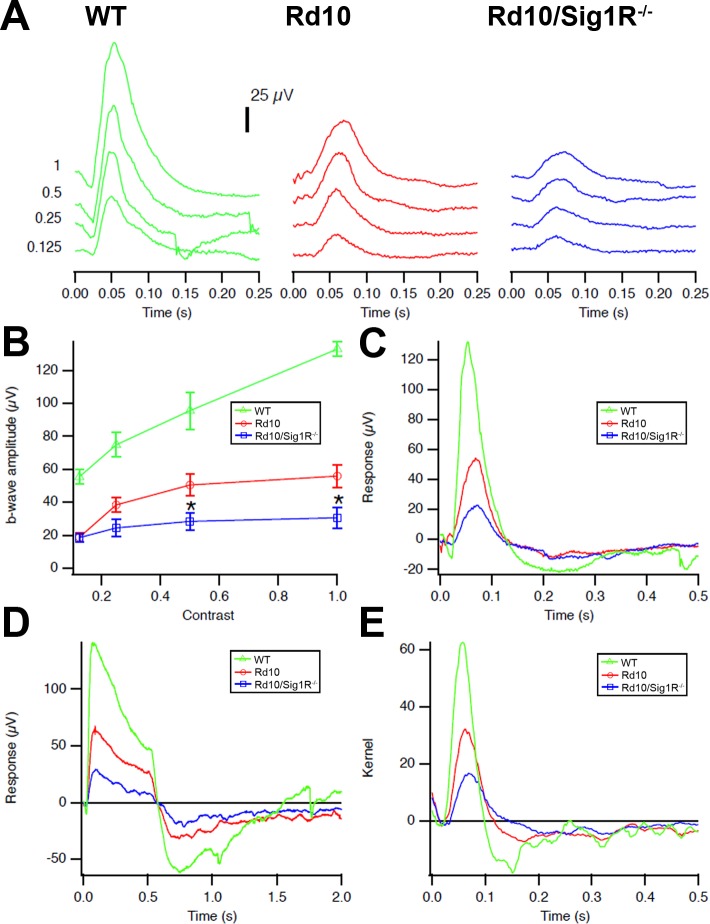
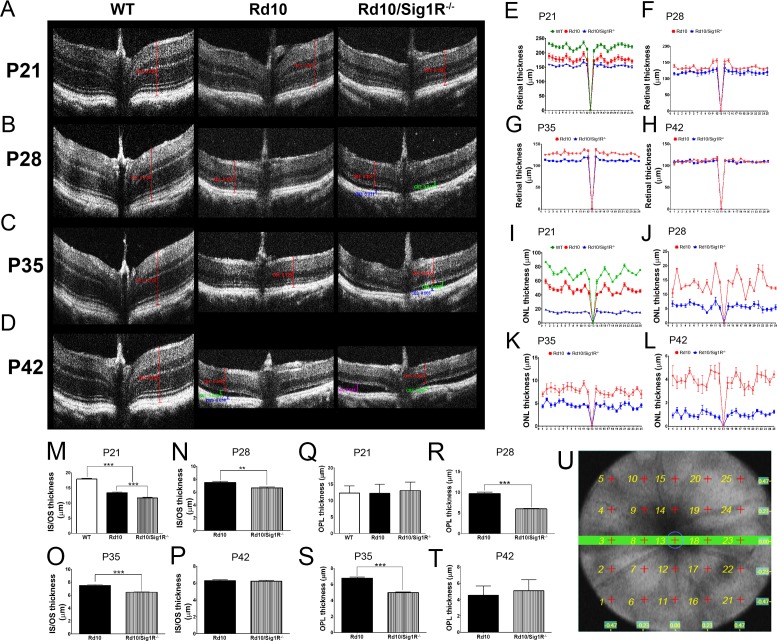
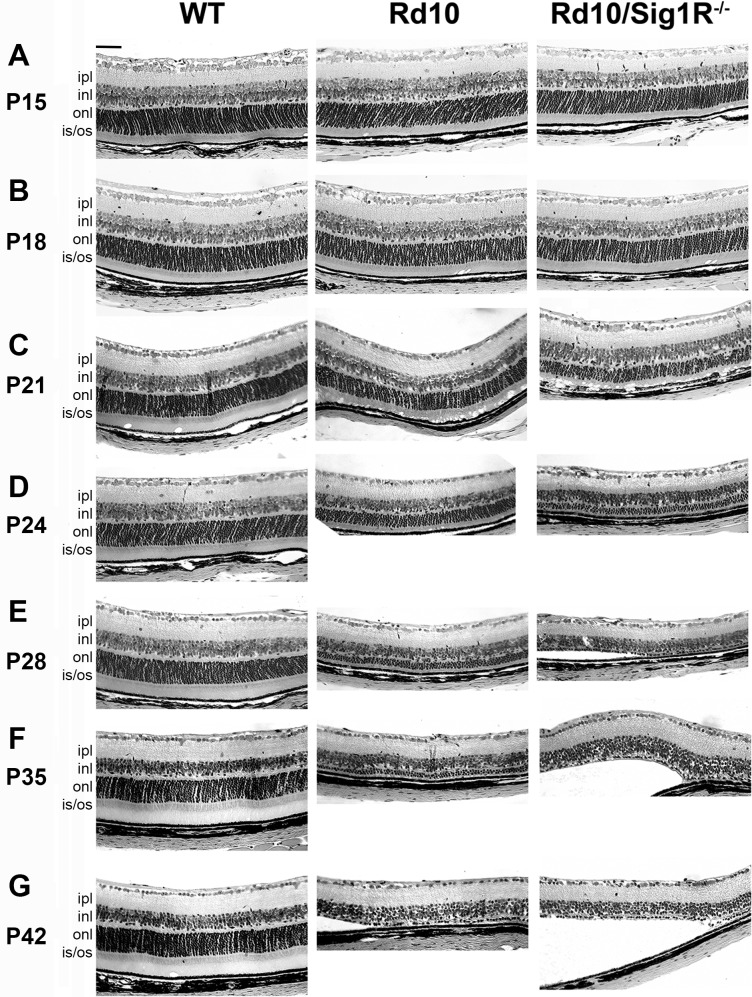
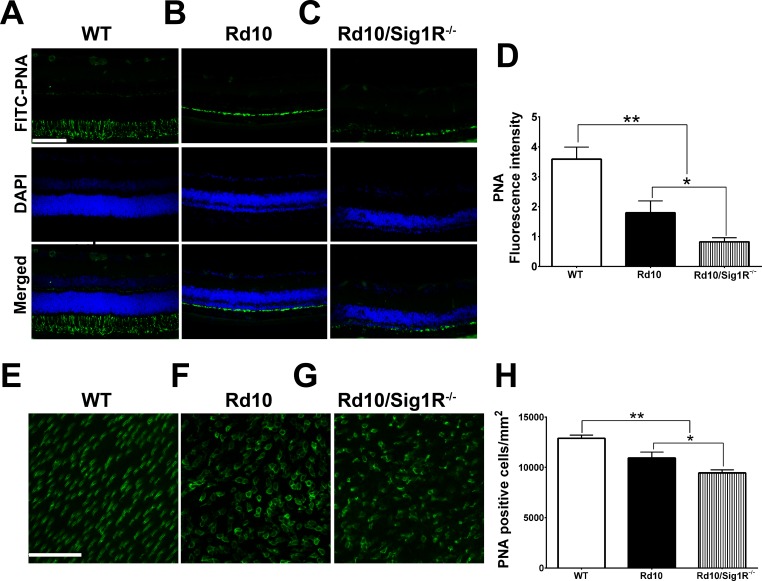
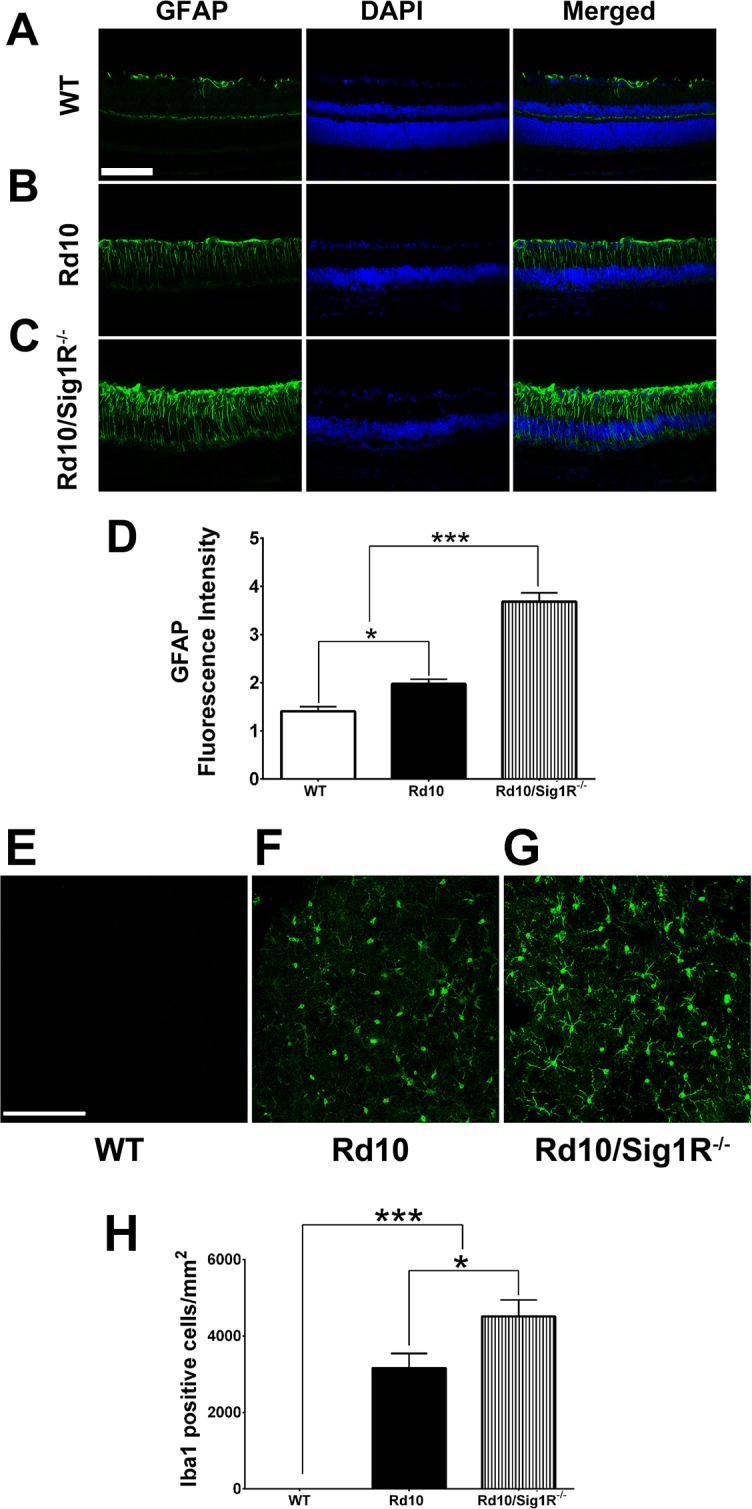
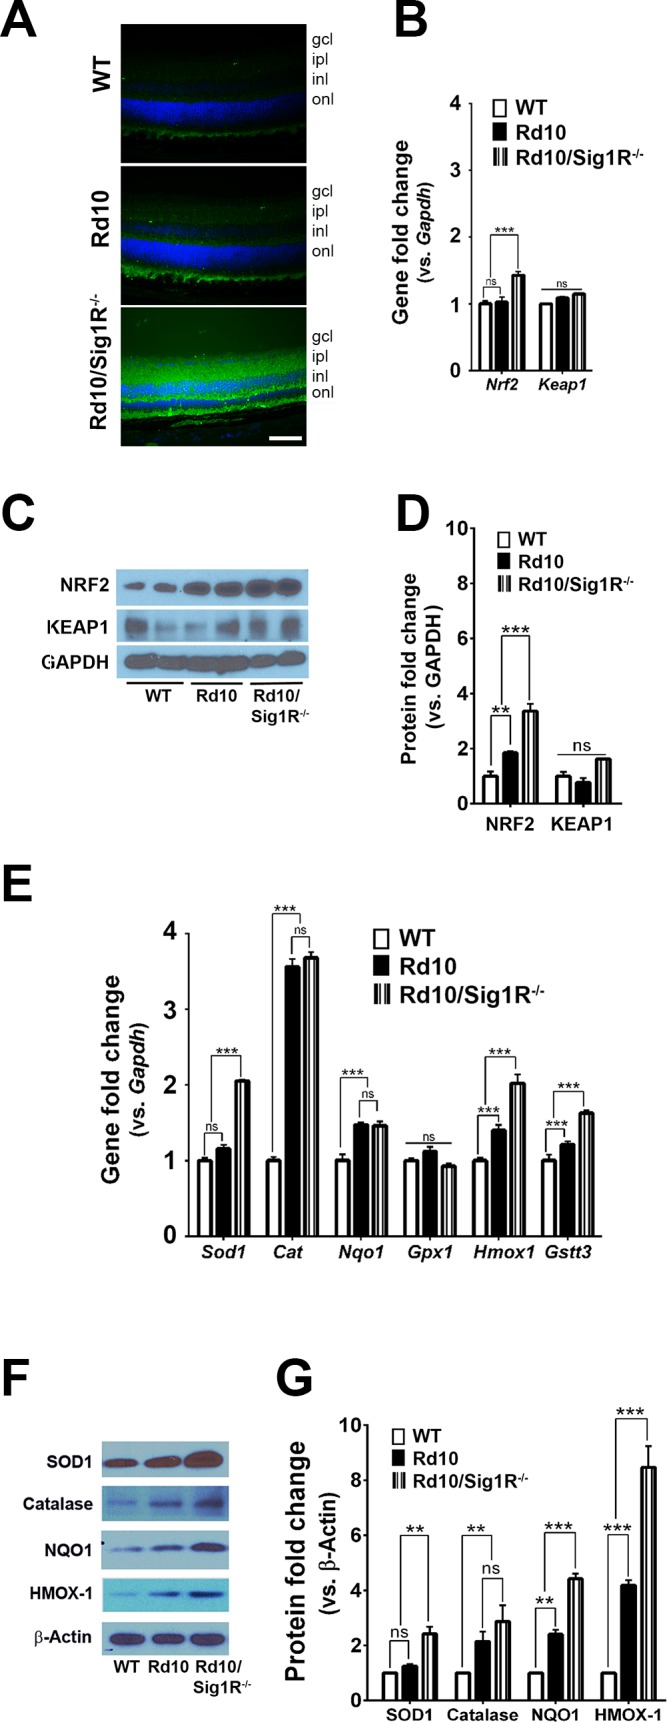
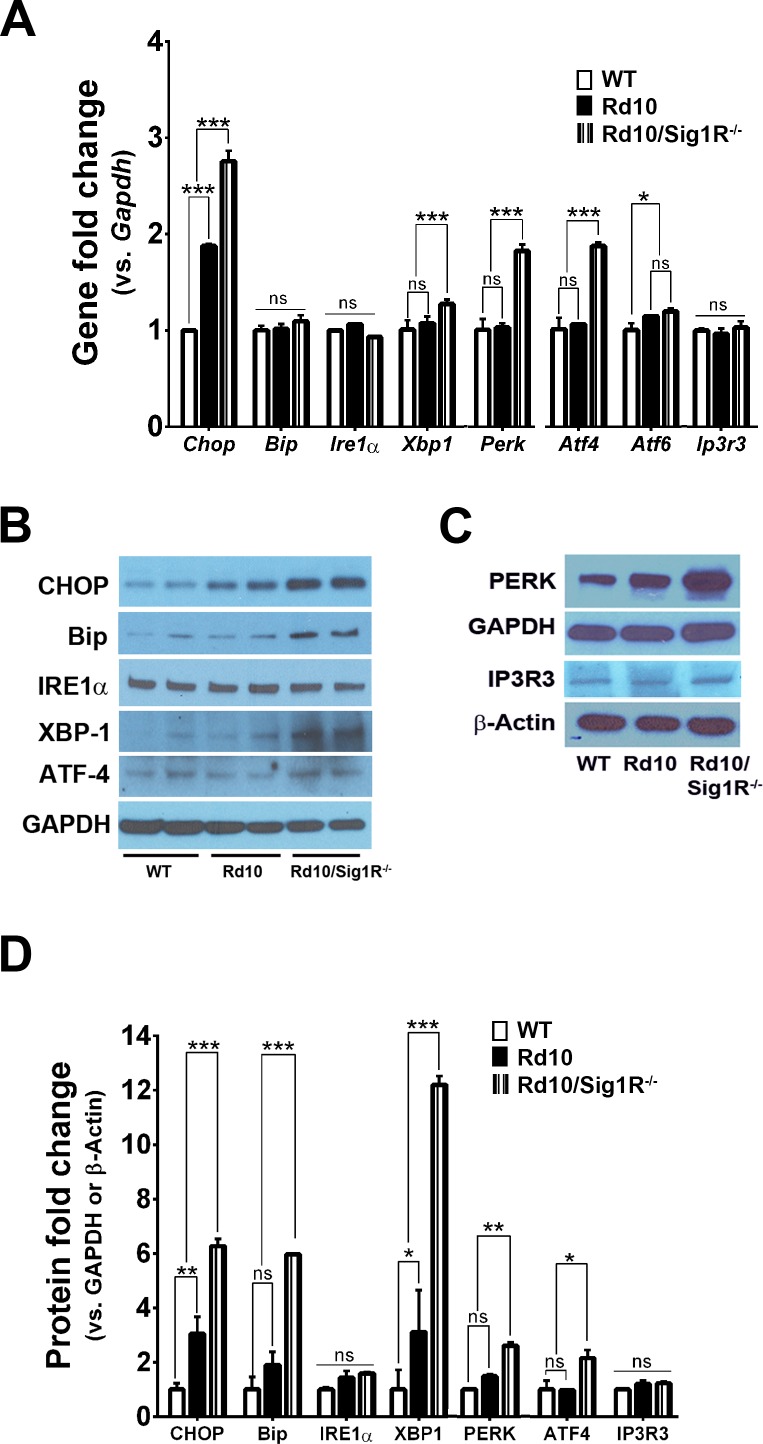
Results: Photopic ERG responses were reduced significantly in rd10/Sig1R-/- versus rd10 mice at P28 (31 ± 6 vs. 56 ± 7 μV), indicating accelerated cone loss when Sig1R was absent. At P28, SD-OCT revealed reduced retinal thickness in rd10/Sig1R-/- mice (60% of WT) versus rd10 (80% of WT). Morphometric analysis disclosed profound photoreceptor nuclei loss in rd10/Sig1R-/- versus rd10 mice. rd10/Sig1R-/- mice had 35% and 60% fewer photoreceptors, respectively, at P28 and P35, than rd10. Peanut agglutinin cone labeling decreased significantly; gliosis increased significantly in rd10/Sig1R-/- versus rd10 mice. At P21, NRF2 levels increased in rd10/Sig1R-/- mice versus rd10 and downstream antioxidants increased indicating oxidative stress. At P28, ER stress genes/proteins, especially XBP1, a potent transcriptional activator of the unfolded protein response and CHOP, a proapoptotic transcription factor, increased significantly in rd10/Sig1R-/- mice versus rd10.
Conclusions: Photoreceptor cell degeneration accelerates and cone function diminishes much earlier in rd10/Sig1R-/- than rd10 mice emphasizing the importance of Sig1R as a modulator of retinal cell survival.
Figures

Similar articles
-
Optimal timing for activation of sigma 1 receptor in the Pde6brd10/J (rd10) mouse model of retinitis pigmentosa.Exp Eye Res. 2021 Jan;202:108397. doi: 10.1016/j.exer.2020.108397. Epub 2020 Dec 9. Exp Eye Res. 2021. PMID: 33310057 Free PMC article.
-
Comparison of Neuroprotective Effects of Monomethylfumarate to the Sigma 1 Receptor Ligand (+)-Pentazocine in a Murine Model of Retinitis Pigmentosa.Invest Ophthalmol Vis Sci. 2020 Mar 9;61(3):5. doi: 10.1167/iovs.61.3.5. Invest Ophthalmol Vis Sci. 2020. PMID: 32150247 Free PMC article.
-
Activation of Sigma 1 Receptor Extends Survival of Cones and Improves Visual Acuity in a Murine Model of Retinitis Pigmentosa.Invest Ophthalmol Vis Sci. 2019 Oct 1;60(13):4397-4407. doi: 10.1167/iovs.19-27709. Invest Ophthalmol Vis Sci. 2019. PMID: 31639826 Free PMC article.
-
Sigma 1 receptor: A novel therapeutic target in retinal disease.Prog Retin Eye Res. 2018 Nov;67:130-149. doi: 10.1016/j.preteyeres.2018.07.003. Epub 2018 Aug 1. Prog Retin Eye Res. 2018. PMID: 30075336 Free PMC article. Review.
-
Fast intrinsic optical signal correlates with activation phase of phototransduction in retinal photoreceptors.Exp Biol Med (Maywood). 2020 Jul;245(13):1087-1095. doi: 10.1177/1535370220935406. Epub 2020 Jun 19. Exp Biol Med (Maywood). 2020. PMID: 32558598 Free PMC article. Review.
Cited by
-
Sigma 1 receptor activation improves retinal structure and function in the RhoP23H/+ mouse model of autosomal dominant retinitis pigmentosa.Exp Eye Res. 2023 May;230:109462. doi: 10.1016/j.exer.2023.109462. Epub 2023 Mar 31. Exp Eye Res. 2023. PMID: 37003581 Free PMC article.
-
Potential Protective and Therapeutic Roles of the Nrf2 Pathway in Ocular Diseases: An Update.Oxid Med Cell Longev. 2020 Mar 23;2020:9410952. doi: 10.1155/2020/9410952. eCollection 2020. Oxid Med Cell Longev. 2020. PMID: 32273949 Free PMC article. Review.
-
Pharmacological Inhibition of Spermine Oxidase Reduces Neurodegeneration and Improves Retinal Function in Diabetic Mice.J Clin Med. 2020 Jan 25;9(2):340. doi: 10.3390/jcm9020340. J Clin Med. 2020. PMID: 31991839 Free PMC article.
-
Delineating the role of eIF2α in retinal degeneration.Cell Death Dis. 2019 May 28;10(6):409. doi: 10.1038/s41419-019-1641-y. Cell Death Dis. 2019. PMID: 31138784 Free PMC article.
-
The molecular chaperone sigma 1 receptor mediates rescue of retinal cone photoreceptor cells via modulation of NRF2.Free Radic Biol Med. 2019 Apr;134:604-616. doi: 10.1016/j.freeradbiomed.2019.02.001. Epub 2019 Feb 10. Free Radic Biol Med. 2019. PMID: 30743048 Free PMC article.
References
-
- Guadagni V, Novelli E, Piano I, Gargini C, Strettoi E. . Pharmacological approaches to retinitis pigmentosa: a laboratory perspective. Prog Retin Eye Res. 2015; 48: 62– 81. - PubMed
-
- Shen J, Yang X, Dong A,et al. . Oxidative damage is a potential cause of cone cell death in retinitis pigmentosa. J Cell Physiol. 2005; 203: 457– 464. - PubMed
Publication types
MeSH terms
Substances
Grants and funding
LinkOut - more resources
Full Text Sources
Other Literature Sources
Molecular Biology Databases
Research Materials
