. 2017 Sep 5;26(3):558-567.e5.
doi: 10.1016/j.cmet.2017.08.012.

Cell-Intrinsic Glycogen Metabolism Supports Early Glycolytic Reprogramming Required for Dendritic Cell Immune Responses

Affiliations

Cell-Intrinsic Glycogen Metabolism Supports Early Glycolytic Reprogramming Required for Dendritic Cell Immune Responses

Phyu M Thwe et al. Cell Metab. .

Erratum in

Abstract

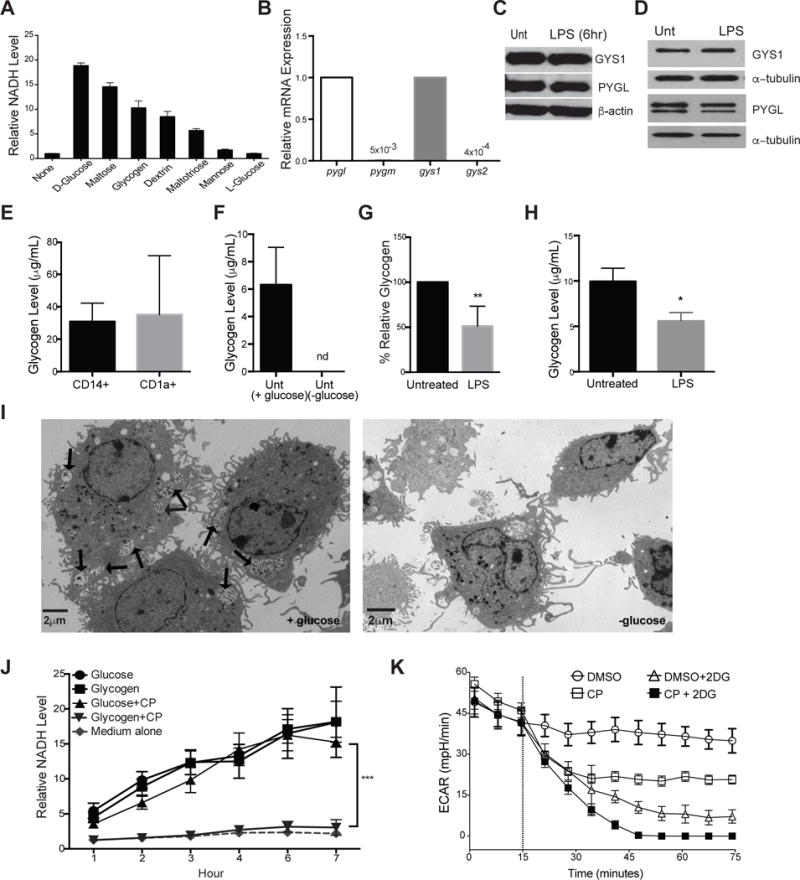
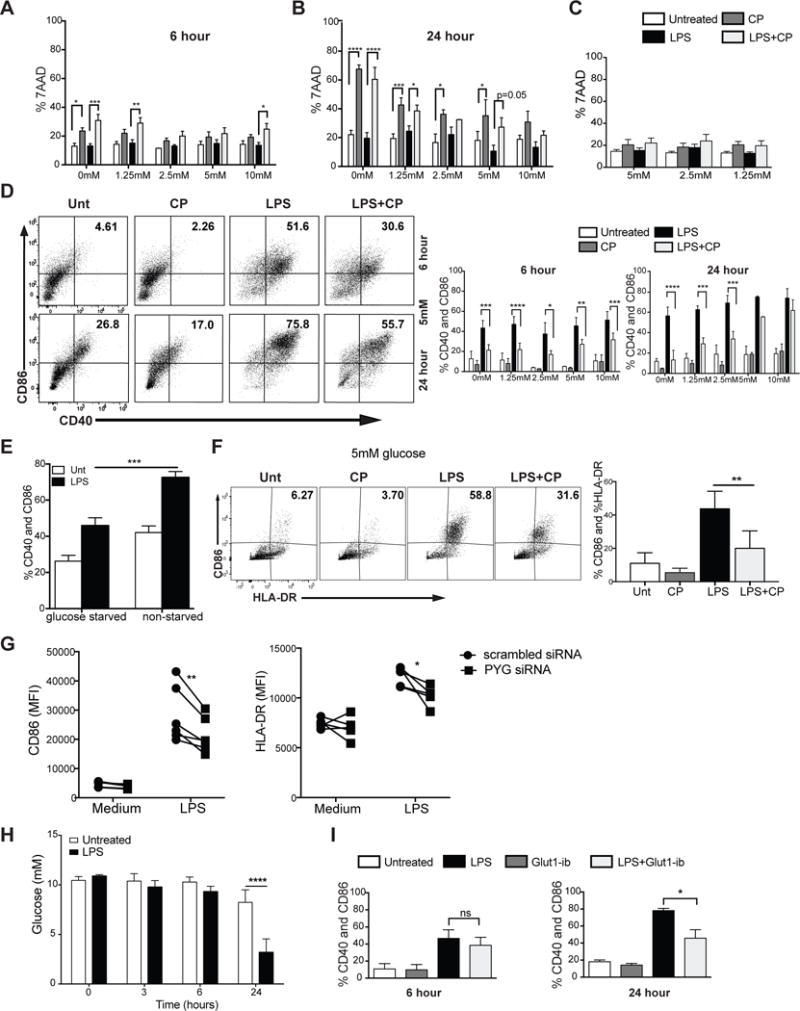
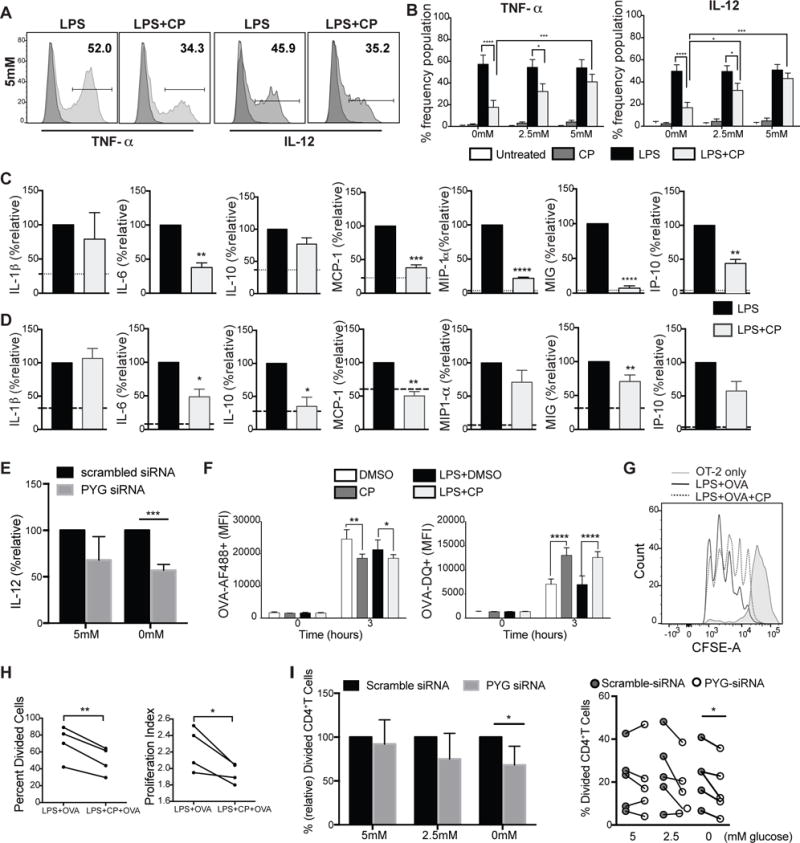
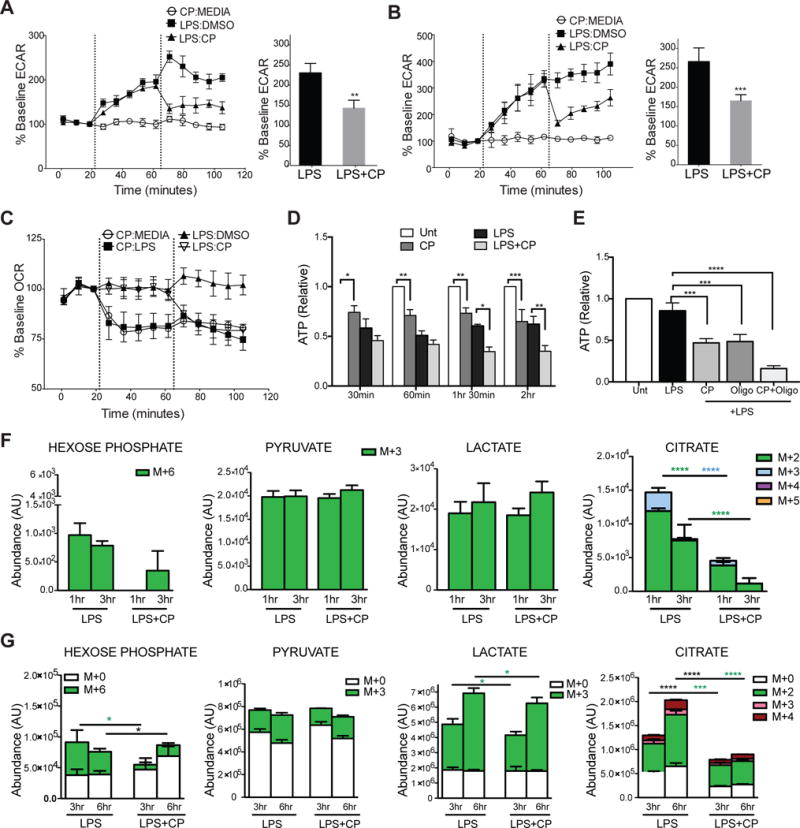
Dendritic cell (DC) activation by Toll-like receptor (TLR) agonists causes rapid glycolytic reprogramming that is required to meet the metabolic demands of their immune activation. Recent efforts in the field have identified an important role for extracellular glucose sourcing to support DC activation. However, the contributions of intracellular glucose stores to these processes have not been well characterized. We demonstrate that DCs possess intracellular glycogen stores and that cell-intrinsic glycogen metabolism supports the early effector functions of TLR-activated DCs. Inhibition of glycogenolysis significantly attenuates TLR-mediated DC maturation and impairs their ability to initiate lymphocyte activation. We further report that DCs exhibit functional compartmentalization of glucose- and glycogen-derived carbons, where these substrates preferentially contribute to distinct metabolic pathways. This work provides novel insights into nutrient homeostasis in DCs, demonstrating that differential utilization of glycogen and glucose metabolism regulates their optimal immune function.

Keywords: PYG; dendritic cells; glycogen; glycogen shunt; glycogenolysis; glycolysis.


Figures

Figure 1
Figure 1. DCs utilize intracellular glycogen metabolism upon LPS stimulation
(A) BMDCs were cultured in the indicated substrates as the sole nutrient sources and measured for ability to produce NADH as described in the methods. Data indicate relative NADH production at 6 hrs normalized to no carbon source controls, n=3. (B) Relative mRNA expression of pyg and gys isoforms in naive BMDCs. (C–D) PYGL, GYS1, and β-actin protein expression in unactivated and 6hr LPS-stimulated BMDCs (C) and 24hr LPS-stimulated moDCs (D). (E–H) Intracellular glycogen levels of: human peripheral blood CD14+ monocytes and CD1a+ DCs (E), untreated BMDCs cultured overnight in ±glucose (F), BMDCs (G) and moDCs (H) stimulated ±LPS in 5mM glucose (n=3–6, mean ±SD, student’s t-test, *P<0.05, ** P=0.0021, nd= not detected). Glycogen levels were normalized to 10ˆ5 cells. (I) TEM images of unactivated BMDCs in 5mM glucose (left) and 0mM glucose (right), with arrows indicating intracellular glycogen deposits identified by tannic acid staining. (J) NADH levels over time in BMDCs cultured in glucose or glycogen containing media (as in A) ±CP (n=4, mean±SD, ***P <0.0001). (K) Basal ECAR of resting BMDCs treated with CP, 2DG, or both (treatment introduced at dotted line), representative of at least 3 replicates.
Figure 2
Figure 2. Glycogen metabolism supports survival and early maturation of TLR-activated DCs
(A–B) 7AAD viability staining of BMDCs stimulated with LPS ± CP for 6hrs (A) and 24hrs (B) at 5mM glucose. (C) 7AAD viability staining of moDCs stimulated with LPS ± CP for 24hrs. (D) BMDCs were stimulated for 6 and 24 hours and analyzed for CD40 and CD86 surface expression. (E) CD40 and CD86 expression of BMDCs stimulated for 6 hrs in free glucose medium with and without glucose starvation. (F) CD86 and HLA-DR expression of moDCs stimulated with LPS±CP for 24hrs in 5mM glucose. (G) CD86 and HLA-DR surface expression of 24hr LPS-stimulated moDCs silenced with control (scrambled) or PYG-targeted siRNA. (H) Glucose measurements from supernatant of BMDCs stimulated with LPS for 3, 6, and 24 hrs. (I) CD40 and CD86 surface expression of BMDCs stimulated ±GLUT1-inhibitor in normal glucose for 6 and 24hr. (A–F, H–I) n=3–6, mean±SD, Two-way ANOVA with Tukey Post-test, *P≤0.05 ***P=0.0006 ****P<0.0001. (G) n=5, Paired t-test, *P=0.04, **P=0.0093.
Figure 3
Figure 3. PYGL inhibition attenuates immune effector functions of DC
(A–B) Intracellular staining of TNF-α and IL-12 of BMDCs stimulated with LPS for 4 hrs in 5mM glucose. (C–D) Multiplex panels of cytokine and chemokine measurements from the supernatant of BMDCs (C)and moDCs (D)activated with LPS for 6 hrs. Dotted lines represent unstimulated levels. (E) Relative IL-12 production by moDCs LPS-stimulated for 24hrs transfected with control or PYG-targeted siRNA. (F) BMDCs treated with LPS ±CP plus OVA-AF488 or OVA-DQ for 3 hours and analyzed by flow cytometry for antigen uptake and processing. (G) BMDCs were pulsed for 6 hours with indicated treatments and subsequently co-cultured with CFSE-labeled OT-II Tcells. CFSE dilution was measured on day 3 post co-culture. (H) Measurements of proliferation of OT-II T cells (from (G)) stimulated by BMDCs pre-treated with indicated conditions. (I) si-RNA transfected moDCs were co-cultured with CellTrace Violet –labeled human naïve CD4+T cells for 4 days. Data were normalized to scrambled siRNA. Proliferation was measured after 4 days. (A–I) n=3–5, mean±SD, (B, F) 2-way ANOVA Tukey Posttest. (C–E, H–I) student’s t-test, *P≤0.05, **P<0.001, ***P=0.0004, ****P<0.0001.
Figure 4
Figure 4. Glycogen-derived carbons fuel early glycolytic reprogramming and mitochondrial respiration in activated DCs
(A–B) Real-time changes in ECAR of BMDCs (A) and moDCs (B). (C) Real-time changes in OCR of BMDCs. (A–C) treatments introduced at dotted lines (1st injection: 2nd injection). (D–E) ATP levels of BMDCs in 30 minute intervals (D) and at 2 hrs (E) after stimulation with indicated treatments. (F) BMDCs cultured and differentiated in 13C6-glucose were switched to normal glucose at the time of stimulation with LPS±CP for 1 and 3 hours and 13C-labeled metabolites were detected by LC-MS spectrometry. (G) Inverse metabolomics of F, where BMDC were differentiated in normal 12C glucose and switched to 13C6-glucose at the time of stimulation with LPS±CP for 3 and 6hrs. Data represent n=4, mean ±SD, (A–B) paired students t-test. (D–G) n=5, Two-way ANOVA, Tukey Posttest. *P<0.05, **P<0.005, ***P<0.0005, ****P<0.0001. (F–G) Statistical significance of each color * represents color-coded 13C6- or black * for 12C groups. White bars indicate l2C-glucose and all color bars denote 13C6-glucose.

Comment in

  • Role of Cellular Metabolism in Pulmonary Diseases.
    Wu D, Woods PS, Duong HT, Mutlu GM. Wu D, et al. Am J Respir Cell Mol Biol. 2018 Jul;59(1):127-129. doi: 10.1165/rcmb.2018-0103RO. Am J Respir Cell Mol Biol. 2018. PMID: 29634283 Free PMC article. No abstract available.

References

    1. Adeva-Andany MM, Gonzalez-Lucan M, Donapetry-Garcia C, Fernandez-Fernandez C, Ameneiros-Rodriguez E. Glycogen metabolism in humans. BBA Clin. 2016;5:85–100. - PMC - PubMed
    1. Afzelius BA. Section staining for electron microscopy using tannic acid as a mordant: a simple method for visualization of glycogen and collagen. Microsc Res Tech. 1992;21:65–72. - PubMed
    1. Akira S, Takeda K. Toll-like receptor signalling. Nat Rev Immunol. 2004;4:499–511. - PubMed
    1. Amati L, Pepe M, Passeri ME, Mastronardi ML, Jirillo E, Covelli V. Toll-like receptor signaling mechanisms involved in dendritic cell activation: potential therapeutic control of T cell polarization. Curr Pharm Des. 2006;12:4247–4254. - PubMed
    1. Amiel E, Everts B, Freitas TC, King IL, Curtis JD, Pearce EL, Pearce EJ. Inhibition of mechanistic target of rapamycin promotes dendritic cell activation and enhances therapeutic autologous vaccination in mice. Journal of immunology. 2012;189:2151–2158. - PMC - PubMed

MeSH terms