. 2017 Sep 5;20(10):2455-2467.
doi: 10.1016/j.celrep.2017.08.049.

Heparin Increases Food Intake through AgRP Neurons

Affiliations

Heparin Increases Food Intake through AgRP Neurons

Canjun Zhu et al. Cell Rep. .

Abstract

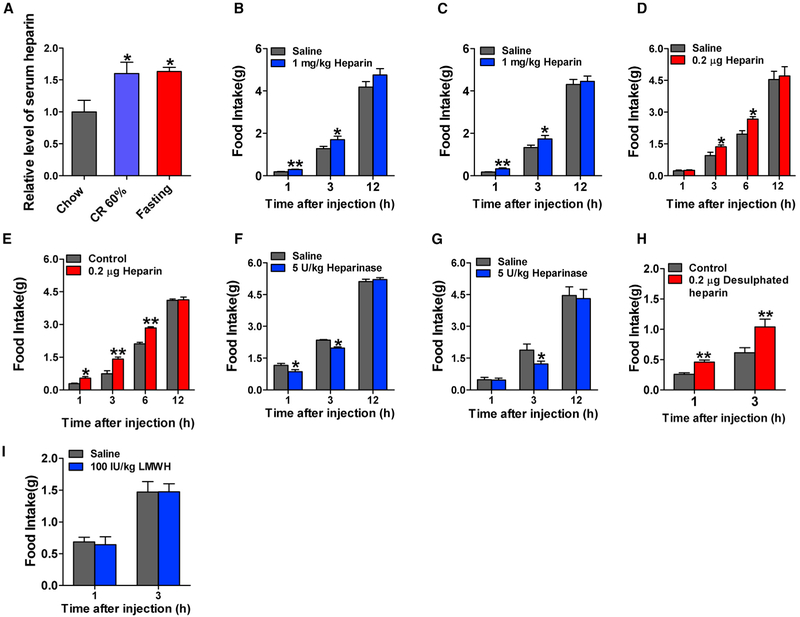
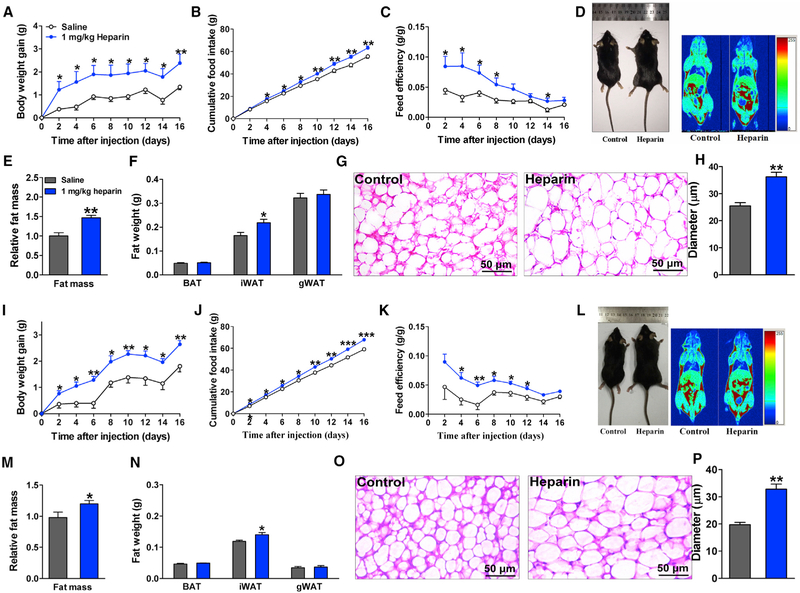
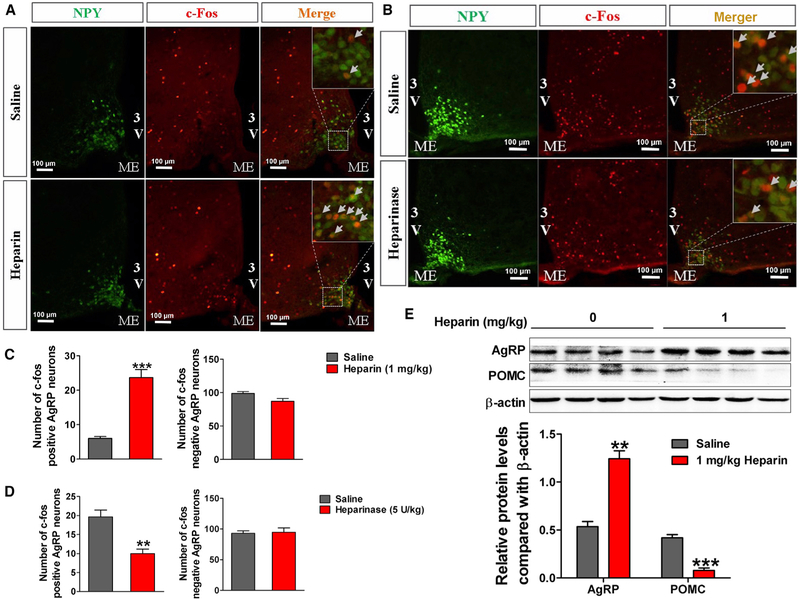
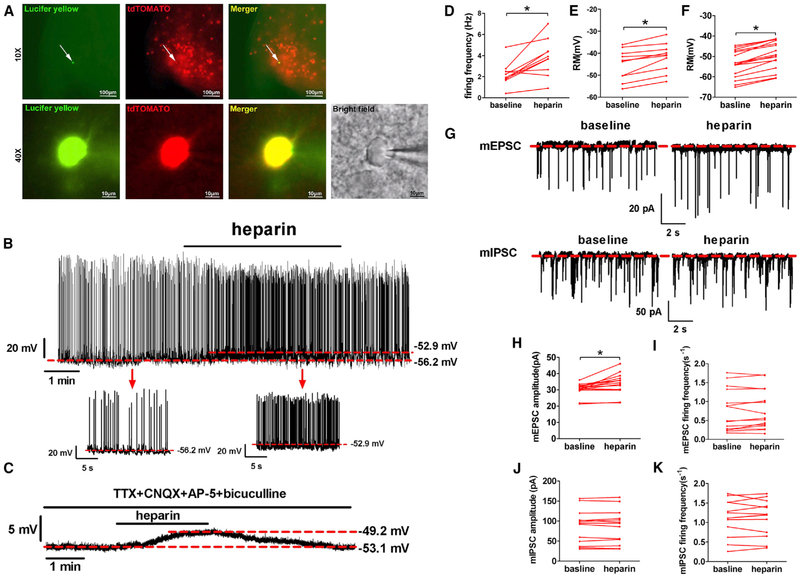
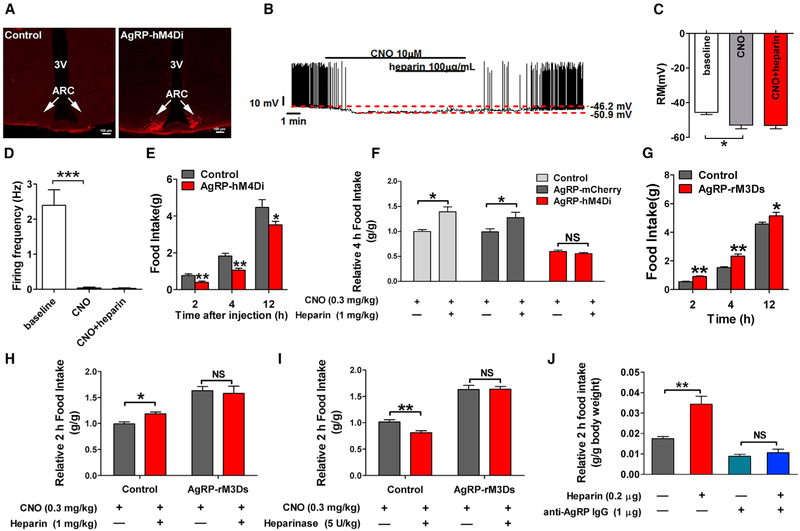
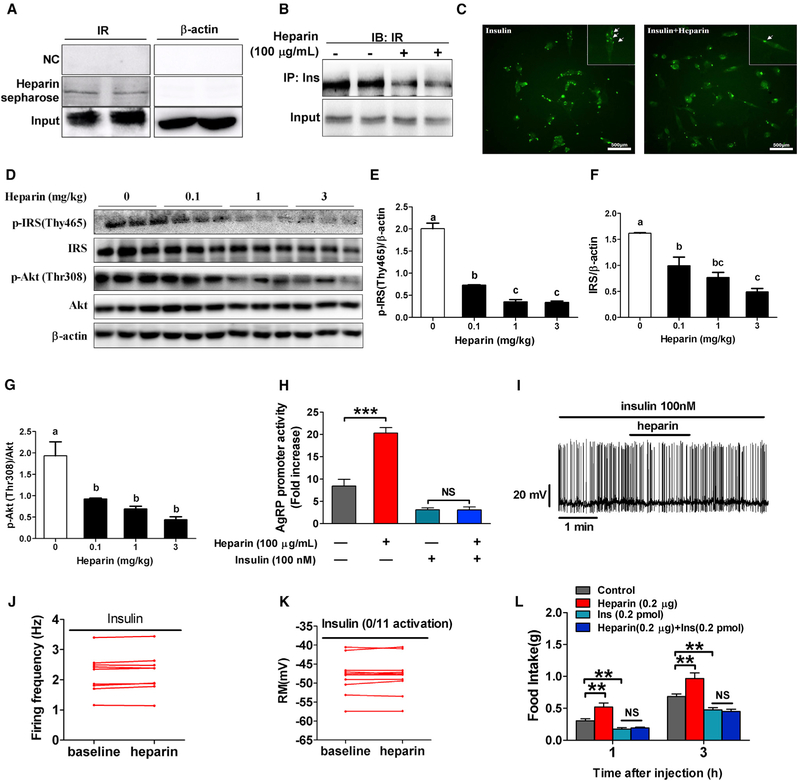
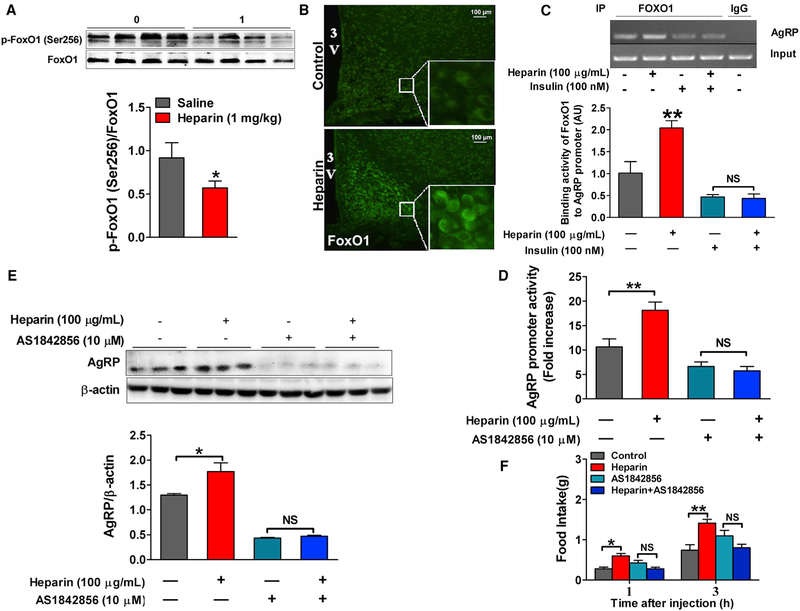
Although the widely used anticoagulant drug heparin has been shown to have many other biological functions independent of its anticoagulant role, its effects on energy homeostasis are unknown. Here, we demonstrate that heparin level is negatively associated with nutritional states and that heparin treatment increases food intake and body weight gain. By using electrophysiological, pharmacological, molecular biological, and chemogenetic approaches, we provide evidence that heparin increases food intake by stimulating AgRP neurons and increasing AgRP release. Our results support a model whereby heparin competes with insulin for insulin receptor binding on AgRP neurons, and by doing so it inhibits FoxO1 activity to promote AgRP release and feeding. Heparin may be a potential drug target for food intake regulation and body weight control.

Keywords: AgRP; food intake; heparin; insulin receptor.


Figures

Figure 1.
Figure 1.. Heparin Synthesis at Different Nutritional States and Acute Effects of Heparin
(A) Serum heparin levels in male C57BL6/J mice fed with normal chow, fed with CR 60% diet, or fasted for 24 hr (n = 7 per group). (B and C) Dark-cycle food intake of male (B, n = 7 or 8 per group) and female (C, n = 7 or 8 per group) C57BL6/J mice after intraperitoneal (i.p.) injection of 1 mg/kg heparin or saline. (D and E) Dark-cycle food intake of male (D, n = 6 per group) and female (E, n = 7 or 8 per group) C57BL6/J mice after intracerebroventricular (i.c.v.) injection of 0.2 μg heparin or saline. (F and G) Dark-cycle food intake of male (F, n = 6 or 7 per group) and female (G, n = 6 or 7 per group) C57BL6/J mice after i.p. injection of 5 U/kg heparinase or saline. (H) Dark-cycle food intake of male C57BL6/J mice after i.c.v. injection of 0.2 μg desulfated heparin or saline (n = 6 per group). (I) Dark-cycle food intake of female C57BL6/J mice after i.p. injection of 100 IU/kg low-molecular-weight heparin (LMWH) or saline (n = 7 or 8 per group). Results are presented as mean ± SEM. In (A), *p ≤ 0.05 by one-way ANOVA followed by post hoc Bonferroni tests. In (B)–(I), *p ≤ 0.05and **p ≤ 0.01 by two-way ANOVA followed by post hoc Bonferroni tests. See also Figure S1.
Figure 2.
Figure 2.. Long-Term Heparin Treatment Induces Body Weight Gain
(A–C) Body weight gain (A), cumulative food intake (B), and feed efficiency (C) of male C57BL6/J mice i.p. injected with 1 mg/kg heparin or saline once or twice each day for 16 days (n = 7 or 8 per group). (D) Representative body image (left) and quantitative magnetic resonance (QMR) (right) of male C57BL6/J mice treated with heparin or saline for 16 days. (E) Quantification of fat mass of male C57BL6/J mice treated with heparin or saline for 16 days (n = 7 or 8 per group). (F) Fat weight (brown adipose tissue [BAT], iWAT, and gonadal white adipose tissue [gWAT]) of male C57BL6/J mice treated with heparin or saline for 16 days (n = 7 or 8 per group). (G and H) Representative images (G) and quantification (H) of iWAT H&E staining from male C57BL6/J mice treated with heparin or saline for 16 days (n = 5 per group). (I–K) Body weight gain (I), cumulative food intake (J), and feed efficiency (K) of female C57BL6/J mice i.p. injected with 1 mg/kg body weight (BW) heparin or saline once or twice each day (n = 7 or 8 per group). (L) Representative body image (left) and QMR (right) of female C57BL6/J mice treated with heparin or saline for 16 days. (M) Quantification of fat mass of female C57BL6/J mice treated with heparin or saline for 16 days (n = 7 or 8 per group). (N) Fat weight (BAT, iWAT, and gWAT) of female C57BL6/J mice treated with heparin or saline for 16 days (n = 7 or 8 per group). (O and P) Representative images (O) and quantification (P) of iWAT H&E staining from female C57BL6/J mice treated with heparin or saline for 16 days (n = 5 per group). Results are presented as mean ± SEM. In (A)–(C) and (I)–(K), *p ≤ 0.05, **p ≤ 0.01, and ***p ≤ 0.001 by two-way ANOVA followed by post hoc Bonferroni tests. In (E), (F), (H), (M), (N), and (P), *p ≤ 0.05 and **p ≤ 0.01 by non-paired Student’s t test. See also Figure S2.
Figure 3.
Figure 3.. Heparin Increases AgRP Signal In Vivo
(A and C) Representative images (A) and quantification (C) of c-Fos expression in the ARH of NPY-GFP mice 3 hr after i.p injection of 1 mg/kg heparin or saline. (B and D) Representative images (B) and quantification (D) of c-Fos expression in the ARH of NPY-GFP mice 3 hr after i.p injection of 5 U/kg heparinase or saline. (E) Immunoblots and quantification of AgRP and POMC protein expression in the hypothalamus of male C57BL6/J mice 3 hr after i.p injection of 1 mg/kg heparin or saline. Results are presented as mean ± SEM. **p ≤ 0.01 and ***p ≤ 0.001 by non-paired Student’s t test.
Figure 4.
Figure 4.. Heparin Activates AgRP Neurons Ex Vivo
(A) Recording from a TOMATO-labeled AgRP/NPY neuron from AgRP-Cre/Rosa26-tdTOMATO mouse (top middle); lucifer yellow dye was injected into the recorded neuron for post hoc verification (top left) and merge (top right). Scale bars represent 100 μm. Low magnification of lucifer yellow (bottom left), td-TOMATO (bottom first middle), merge (bottom second middle), and bright field (bottom right). Scale bars represent 10 μm. (B–F) Representative trace and statistic of AgRP neurons responding to heparin (100 μg/mL) in the absence (B, D, and E) or presence (C and F)of 1 μM TTX, 30 mM CNQX, 30 μM AP-5, and 50 μM bicuculline. (G–K) Representative mEPSC and mIPSC trace (G) and statistics (H–K) of AgRP neurons responding to heparin (100 μg/mL). Results are presented as mean ± SEM. *p ≤ 0.05 by non-paired Student’s t test.
Figure 5.
Figure 5.. AgRP Neurons Mediate Orexigenic Effects of Heparin
(A) mCherry fluorescence after injection of inhibitory AAV-hM4Di-mCherry into the ARH of WT or AgRP-Cre mice. (B) Representative electrophysiological response to CNO (10 μM, bath) and heparin (100 μg/mL) in ARH AgRP neurons infected with inhibitory AAV-hM4Di-mCherry. (C and D) Statistics of resting membrane potential (C) and firing frequency (D). (E) Effects of CNO (0.3 mg/kg, i.p.) on dark-cycle food intake measured in male WT or AgRP-Cre mice receiving inhibitory AAV-hM4Di-mCherry infection in the ARH (n = 10 or 6 per group). (F) Effects of CNO (0.3 mg/kg) co-injected with saline or heparin (1 mg/kg) on dark-cycle food intake measured in male WT or AgRP-Cre mice receiving inhibitory AAV-hM4Di-mCherry infection in the ARC. Another group of AgRP-Cre mice were injected with AAV-DIO-mCherry to serve as another control group (n = 10, 6, or 6 per group). (G) Effects of CNO (0.3 mg/kg, i.p.) on dark-cycle food intake measured in male WT or AgRP-Cre mice receiving AAV-rM3D(Gs)-mCherry infection in the ARH (n = 6 or 5 per group). (H) Effects of CNO (0.3 mg/kg) co-injected with saline or heparin (1 mg/kg) on dark-cycle food intake measured in male WT or AgRP-Cre mice receiving AAV-rM3D(Gs)-mCherry infection in the ARH (n = 6 or 5 per group). (I) Effects of CNO (0.3 mg/kg) co-injected with saline or heparinase (5 U/kg) on dark-cycle food intake measured in male WT or AgRP-Cre mice receiving AAV-rM3D(Gs)-mCherry infection in the ARH (n = 6 or 5 per group). (J) Dark-cycle food intake of female C57BL6/J mice after i.c.v. injection of saline, 0.2 μg heparin, 1 μg anti-AgRP IgG, or heparin + anti-AgRP IgG (0.2 μg + 1 μg) (n = 7 or 8 per group). Results are presented as mean ± SEM. *p ≤ 0.05 and **p ≤ 0.01 by one-or two-way ANOVA followed by post hoc Bonferroni tests. See also Figure S3.
Figure 6.
Figure 6.. Heparin Promotes AgRP Activity and Feeding by Competing for Insulin Binding to the Insulin Receptor
(A) Interaction between heparin and insulin receptor (IR) in N38 cells. (B) Heparin inhibits insulin-IR interaction in N38 cells. (C) Representative immunocytofluorescent images of insulin binding in N38 cells cultured with vehicle or 100 μg/mL heparin for 3 hr and subsequently cultured with 100 nM insulin for 30 min. (D–G) Immunoblots (D) and quantification of p-IRS (E), IRS (F), and p-Akt/Akt (G) protein expression in the hypothalamus of male C57BL6/J mice after i.p. injection of saline or 0.1, 1, or 3 mg/kg heparin (n = 6 per group). (H) Relative luciferase activity driven by Agrp promoter (FOXO1 binding fragment)in N38 cells cultured with vehicle (control), 100 μg/mL heparin, 100 nM insulin, or 100 μg/mL heparin + 100 nM insulin for 3 hr (n = 6 per group). (I-K) Representative trace (I) and statistics (J and K) of AgRP neurons responding to heparin (100 μg/mL) in the presence of 100 nM insulin. (L) Dark-cycle food intake of female C57BL6/J mice after i.c.v. injection of saline, 0.2 μg heparin, 2 μL 100 nM insulin, or heparin + insulin (n = 5 or 6 per group). Results are presented as mean ± SEM. In (E)–(G), different letters between bars indicate p ≤ 0.05 by one-way ANOVA followed by post hoc Tukey’s tests. In (H) and (L), *p ≤ 0.05, **p ≤ 0.01, and ***p ≤ 0.001 by two-way ANOVA followed by post hoc Bonferroni tests. See also Figures S4–S6.
Figure 7.
Figure 7.. Heparin Promotes AgRP Expression and Secretion by FoxO1
(A) Immunoblots and quantification of p-FoxO1/FoxO1 protein expression in the hypothalamus of male C57BL6/J mice after 16 days of saline or 1 mg/kg heparin i.p. injection (n = 8 per group). (B) Representative images of FoxO1 immunofluorescent staining (green) in the hypothalamus of male C57BL6/J mice after 16 days of saline or 1 mg/kg heparin i.p. injection. (C) Use of chromatin immunoprecipitation (ChIP) assays to detect the binding activity of FoxO1 to AgRP promoter in N38 cells cultured with vehicle, 100 μg/mL heparin, 100 nM insulin, or heparin + insulin (100 μg/mL+100 nM) for 3 hr (n = 6 per group). (D) Relative luciferase activity driven by Agrp promoter (FOXO1 binding fragment) in N38 cells cultured with vehicle (control), 100 μg/mL heparin, 10 μM AS1842856 (FoxO1 antagonist), or 100 μg/mL heparin + 10 μM AS1842856 for 3 hr (n = 6 per group). (E) Immunoblots and quantification of AgRP protein expression in N38 cells cultured with vehicle, 100 μg/mL heparin, 10 μM AS1842856, or 100 μg/mL heparin + 10 μM AS1842856 for 12 hr (n = 6 per group). (F) Dark-cycle food intake of female C57BL6/J mice after i.c.v. injection of saline, 0.2 μg heparin, 20 pmol AS1842856, or heparin + AS1842856 (0.2 μg + 20 pmol) (n = 6 per group). Results are presented as mean ± SEM. *p ≤ 0.05 and **p ≤ 0.01 by two-way ANOVA followed by post hoc Bonferroni tests. See also Figure S7.

References

    1. Accili D, and Arden KC (2004). FoxOs at the crossroads of cellular metabolism, differentiation, and transformation. Cell 117, 421–426. - PubMed
    1. Allman-Farinelli MA (2011). Obesity and venous thrombosis: a review. Semin. Thromb. Hemost 37, 903–907. - PubMed
    1. Aponte Y, Atasoy D, and Sternson SM (2011).AGRP neurons are sufficient to orchestrate feeding behavior rapidly and without training. Nat. Neurosci 14, 351–355. - PMC - PubMed
    1. Biebermann H, Kühnen P, Kleinau G, and Krude H (2012). The neuroendocrine circuitry controlled by POMC, MSH, and AGRP. Handb. Exp. Pharmacol (203), 47–75.. - PubMed
    1. Bloom MB, Zaw AA, Hoang DM, Mason R, Alban RF, Chung R, Melo N, Volod O, Ley EJ, and Margulies DR (2016). Body mass index strongly impacts the diagnosis and incidence of heparin-induced thrombocytopenia in the surgical intensive care unit. J. Trauma Acute Care Surg 80, 398–403. - PubMed