. 2018 Jan;32(1):220-229.
doi: 10.1096/fj.201700324R. Epub 2017 Sep 6.

Organ- and cell-specific immune responses are associated with the outcomes of intracerebral hemorrhage

Affiliations

Organ- and cell-specific immune responses are associated with the outcomes of intracerebral hemorrhage

Jing Zhang et al. FASEB J. 2018 Jan.

Abstract

Severe brain injury significantly influences immune responses; however, the levels at which this influence occurs and which neurogenic pathways are involved are not well defined. Here, we used MRI to measure spleen volume and tissue diffusion changes in patients with intracerebral hemorrhage (ICH). We observed increased capillary exchange and spleen shrinkage by d 3 post-ICH, with recovery by d 14. The extent of spleen shrinkage was associated with brain hematoma size, and a reduced progression of perihematomal edema was observed in the presence of severe spleen shrinkage. At the cellular level, lymphopenia was present in patients with ICH at admission and persisted up to 14 d. Lymphopenia did not parallel the observed spleen alteration. In addition, patients with ICH with infection had significant deficiencies of T and NK cells and poor functional outcomes. Finally, in mouse models of ICH, spleen shrinkage could be related to innervations from adrenergic input and the hypothalamus-pituitary-adrenal (HPA) axis. In sum, the profound impact of ICH on the immune system involves the coordinated actions of sympathetic innervation and the HPA axis, which modulate spleen shrinkage and cellular immunity.-Zhang, J., Shi, K., Li, Z., Li, M., Han, Y., Wang, L., Zhang, Z., Yu, C., Zhang, F., Song, L., Dong, J.-F., La Cava, A., Sheth, K. N., Shi, F.-D. Organ- and cell-specific immune responses are associated with the outcomes of intracerebral hemorrhage.

Keywords: hemorrhagic brain injury; immunosuppression; infection; spleen.


Figures

Figure 1.
Figure 1.
Spleen shrinkage and increased capillary perfusion after ICH onset. A) Representative images of abdominal MRI with T2-weighted images and DWI at 9 consecutive b values from 0 to 1000. Spleen volumes were calculated from T2 images. Red outlines show the spleen, and yellow circles show the ROI for measuring signal intensity of the spleen from DWI images at different b values—signal density decayed with increasing b values. IVIM-DWI parameters, D and D*, were derived from these multiple DWIs. B) Representative abdominal MRIs from a patient with ICH at d 3 and 14 after ICH show an enlarged spleen at d 14 compared with d 3 (spleen is outlined in red; right). DWI images at b = 0 of the same patient show that the signal density of the spleen at d 3 was higher than at d 14, which indicates increased perfusion at d 3 post-ICH (left). C) Quantitative analysis shows dynamic changes of spleen volume after ICH onset. D and D* values of spleen are compared; the horizontal line inside each box indicates the median. The top and bottom of the box indicate the interquartile range, and error bars indicate the 5th and 95th percentiles. Comparisons were performed by using the Mann-Whitney test. Ns, not significant. *P < 0.05, **P < 0.01.
Figure 2.
Figure 2.
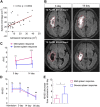
Spleen shrinkage is associated with hematoma size at admission and with progression of PHE. A) Association between the extent of spleen shrinkage and hematoma volume at admission. Spleen shrinkage equals spleen volume at d 14 minus spleen volume at d 3 on MRI. All 39 patients with ICH were included. Spearman r and P values show correlations. Patients were subdivided into 2 groups according to the average extent of spleen shrinkage. Spleen shrinkage of >37 cm3 was considered to be severe, and spleen shrinkage of <37 cm3 to be mild. B) Representative brain MRI scans at T2 FLAIR of 2 patients with spleen shrinkage volumes of 26.2 or 48.4 cm3, respectively, showing PHE as red outlines. C) rPHE of patients measured by MRI at T2 FLAIR sequence at d 3 and 14 after ICH onset. rPHE was calculated as PHE divided by hematoma. Two-way repeated measurements ANOVA was used for comparison. Data are shown as means ± sd. D) NIHSS score changes at the indicated time points are shown as means ± sd (2-way ANOVA). E) Comparison of NIHSS decrease from admission to 90 d. ns, not significant; SS, spleen shrinkage. *P < 0.05, **P < 0.01, ***P < 0.001 (Student’s t test).
Figure 3.
Figure 3.
Persistence of lymphopenia after ICH onset and association between lymphocyte deficiency and increased susceptibility to infection. A) Lymphocyte and monocyte subset counts in the peripheral blood of healthy controls (black) and patients with ICH (red) at admission and 3 and 14 d after ICH. Lymphocyte counts were inferred from routine blood tests. All other cell subsets were detected via flow cytometry, following gating strategies: CD3+CD4+ for CD4+ T cells; CD3+CD8+ for CD8+ T cells; CD3CD19+ for B cells; CD3CD56+ for NK cells; CD11b+ for monocytes; and CD11c+ for dendritic cells. Patients with ICH were subdivided into groups according to the extent of spleen shrinkage and the presence or absence of infection during hospitalization after ICH. B) Comparison of immune cell subset counts in the blood in relation to spleen shrinkage. C) Association between infection and immune cell subset counts. Data are shown as means ± sd. Comparisons were performed by using Student’s t test. *P < 0.05, **P < 0.01, ***P < 0.001, ****P < 0.0001 (ICH patients vs. healthy controls); #P < 0.05, ##P < 0.01 (patients with infection vs. patients without infection).
Figure 4.
Figure 4.
Spleen shrinkage after ICH is a result of synergism between the adrenergic and HPA axis. A, B) Spleen weight changes at indicated time points in mice with ICH induced by 0.0375 U collagenase (A) or 30 μl autologous blood (B) injected into the right basal ganglia of male adult C57BL/6 mice. Means ± sd and Student’s t test (n = 6 for each time point). C) Representative images of brain hematoma and spleen of mice that were injected with different doses of collagenase (left). Hematoma volume and spleen weight of mice that were injected with different doses of collagenase (right; means ± sd, 1-way ANOVA, n = 6 per group). D) Representative hematoxylin and eosin staining of spleen from mice with ICH induced by intracerebral injection of 0.0375 U collagenase (left). Sham-treated controls were injected with PBS. Scale bars, 200 μm. Comparison of splenic white pulp area (right; means ± sd, Student’s t test, n = 9 for each group). E) Representative images of spleen and spleen weight of collagenase-injected mice with ICH that were treated with the indicated blockers. Spleen weights were measured at d 3 (means ± sd, 1-way ANOVA, n = 6 in each group). F) Plasma concentration of neurotransmitters and glucocorticoid hormones detected by ELISA at d 3 and 14 after ICH (means ± sd, 1-way ANOVA). ns, not significant; RU486, mifepristone. *P < 0.05, **P < 0.01, ***P < 0.001.

References

    1. Qureshi A. I., Mendelow A. D., Hanley D. F. (2009) Intracerebral haemorrhage. Lancet 373, 1632–1644 - PMC - PubMed
    1. Keep R. F., Hua Y., Xi G. (2012) Intracerebral haemorrhage: mechanisms of injury and therapeutic targets. Lancet Neurol. 11, 720–731 - PMC - PubMed
    1. Fu Y., Liu Q., Anrather J., Shi F. D. (2015) Immune interventions in stroke. Nat. Rev. Neurol. 11, 524–535 - PMC - PubMed
    1. Li M., Li Z., Ren H., Jin W. N., Wood K., Liu Q., Sheth K. N., Shi F. D. (2016) Colony stimulating factor 1 receptor inhibition eliminates microglia and attenuates brain injury after intracerebral hemorrhage. J. Cereb. Blood Flow Metab. 37, 2383–2395 - PMC - PubMed
    1. Hammond M. D., Taylor R. A., Mullen M. T., Ai Y., Aguila H. L., Mack M., Kasner S. E., McCullough L. D., Sansing L. H. (2014) CCR2+ Ly6Chi inflammatory monocyte recruitment exacerbates acute disability following intracerebral hemorrhage. J. Neurosci. 34, 3901–3909 - PMC - PubMed

Publication types

MeSH terms

LinkOut - more resources