. 2017 Sep 6;9(406):eaan3968.
doi: 10.1126/scitranslmed.aan3968.

Nondestructive tissue analysis for ex vivo and in vivo cancer diagnosis using a handheld mass spectrometry system

Affiliations

Nondestructive tissue analysis for ex vivo and in vivo cancer diagnosis using a handheld mass spectrometry system

Jialing Zhang et al. Sci Transl Med. .

Abstract

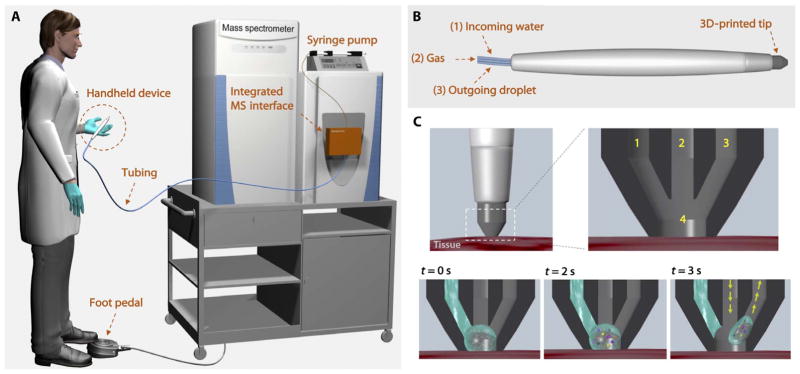
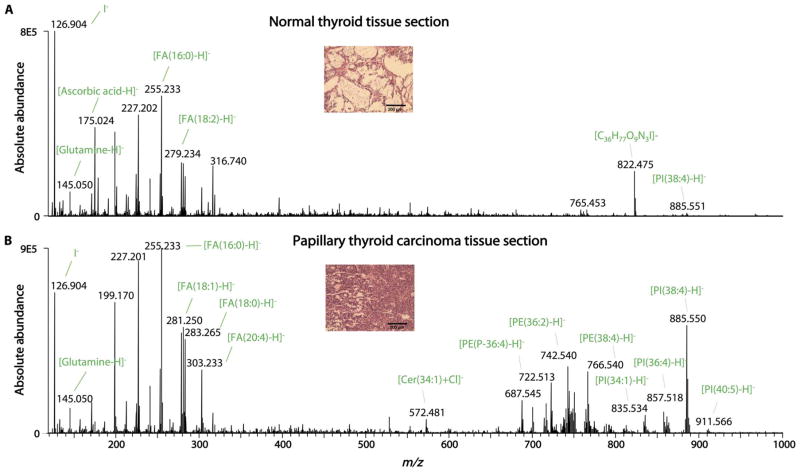
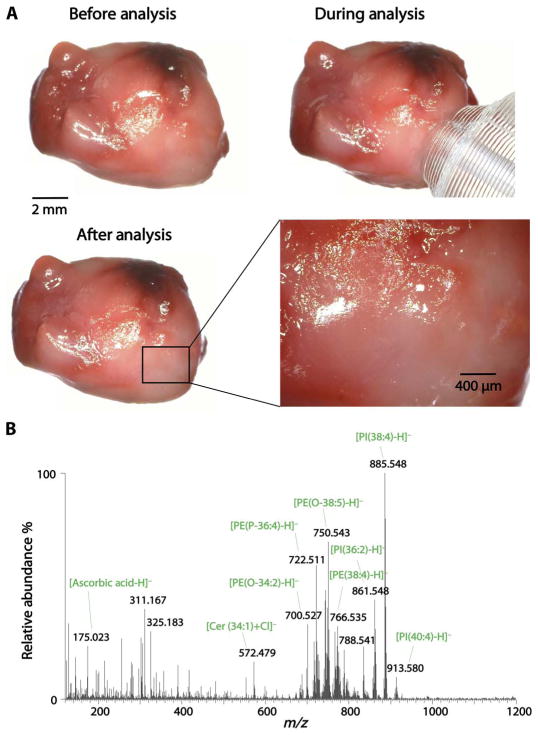
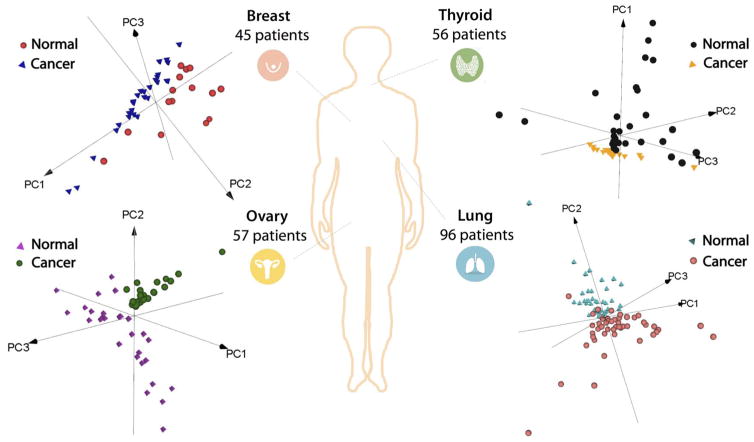
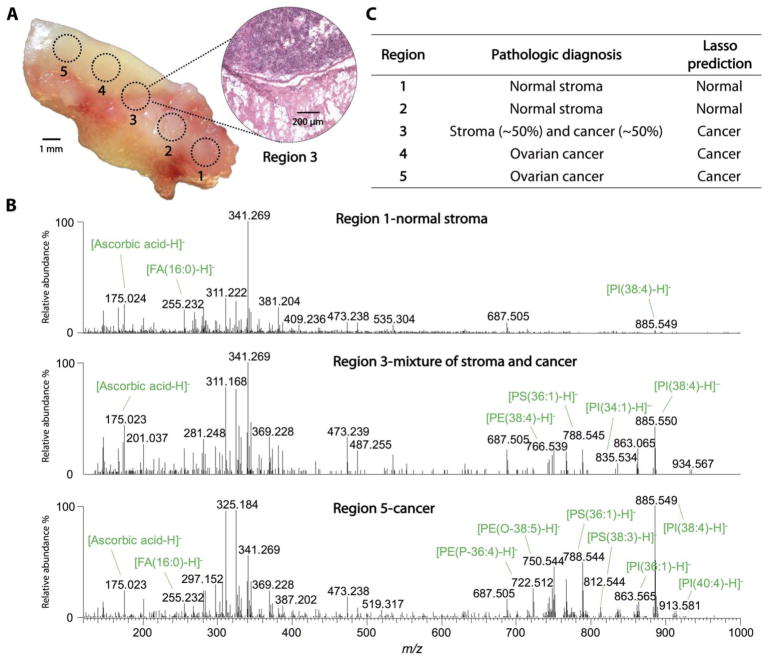
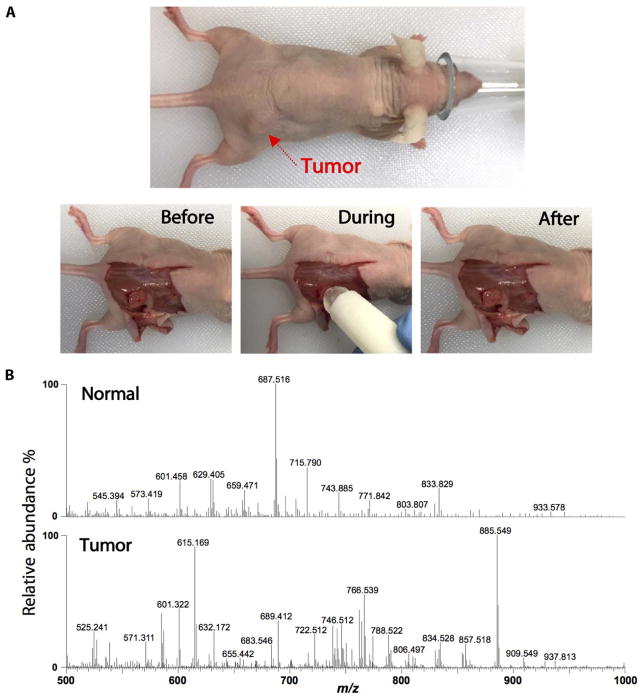
Conventional methods for histopathologic tissue diagnosis are labor- and time-intensive and can delay decision-making during diagnostic and therapeutic procedures. We report the development of an automated and biocompatible handheld mass spectrometry device for rapid and nondestructive diagnosis of human cancer tissues. The device, named MasSpec Pen, enables controlled and automated delivery of a discrete water droplet to a tissue surface for efficient extraction of biomolecules. We used the MasSpec Pen for ex vivo molecular analysis of 20 human cancer thin tissue sections and 253 human patient tissue samples including normal and cancerous tissues from breast, lung, thyroid, and ovary. The mass spectra obtained presented rich molecular profiles characterized by a variety of potential cancer biomarkers identified as metabolites, lipids, and proteins. Statistical classifiers built from the histologically validated molecular database allowed cancer prediction with high sensitivity (96.4%), specificity (96.2%), and overall accuracy (96.3%), as well as prediction of benign and malignant thyroid tumors and different histologic subtypes of lung cancer. Notably, our classifier allowed accurate diagnosis of cancer in marginal tumor regions presenting mixed histologic composition. Last, we demonstrate that the MasSpec Pen is suited for in vivo cancer diagnosis during surgery performed in tumor-bearing mouse models, without causing any observable tissue harm or stress to the animal. Our results provide evidence that the MasSpec Pen could potentially be used as a clinical and intraoperative technology for ex vivo and in vivo cancer diagnosis.


Conflict of interest statement

Competing interests: L.S.E., T.E.M., J.Z., J.L., J.R., N.K., and A.Z. are inventors on a provisional patent application 62/462,524 owned by the Board of Regents of the University of Texas System that relates to a handheld probe and MS system, such as described in this study. All other authors declare that they have no competing interests.

Figures

Fig. 1
Fig. 1. Schematic representation of the MasSpec Pen system and operational steps
(A) The pen-sized handheld device is directly integrated into a laboratory-built MS interface through PTFE tubing. The integrated MS interface houses the pinch valves, microcontroller, and tubing to connect the system to the mass spectrometer inlet. The system is triggered by the user through a foot pedal. (B) The MasSpec Pen (handheld device) is designed with a PDMS tip and three PTFE conduits, which provide incoming water (1) and gas (2) to the tip and an outgoing conduit for the water droplet (3). (C) The tip contacts the tissue for analysis. Inset shows the three conduits (1 to 3) and solvent reservoir (4) within the tip. When the system is triggered (t = 0 s) by using the foot pedal, the syringe pump delivers a controlled volume of water to the reservoir. The discrete water droplet interacts with the tissue to extract the molecules (t = 2 s). After 3 s of extraction, the vacuum and the gas conduits are concomitantly opened (arrows) to transport the droplet from the MasSpec Pen to the mass spectrometer through the tubing system for molecular analysis.
Fig. 2
Fig. 2. MasSpec Pen analysis of PTC and normal thyroid tissue sections
(A) A representative negative ion mode MasSpec Pen mass spectra obtained from a normal human thyroid tissue section (average of n = 5 mass spectra) and (B) a PTC tissue section (average of n = 4 mass spectra) are shown. Identification of the most abundant molecular ions is provided. Insets shows an optical image of the H&E-stained tissue sections evaluated by histopathology.
Fig. 3
Fig. 3. Nondestructive molecular analysis of human tissue samples using the MasSpec Pen
(A) Optical images show a lung adenocarcinoma tissue sample before, during, and after the MasSpec Pen analysis. A magnification of the tissue specimen (inset) shows no macroscopic damage to the tissue region analyzed by the MasSpec Pen. (B) Negative ion mode mass spectrum obtained for the tissue region analyzed including the identification of the most abundant molecular ions.
Fig. 4
Fig. 4. PCA of the data obtained from human tissue samples using the MasSpec Pen
A total of 253 patient tissue samples were analyzed including breast (n = 45), thyroid (n = 56), ovary (n = 57), and lung (n = 96) cancer and normal tissue samples. 3D PCA (PC1, PC2, and PC3) score plots are shown for each tissue type. The first three PCs explain the 77, 69, 51, and 87% of the total variance of breast, thyroid, lung, and ovarian data sets, respectively.
Fig. 5
Fig. 5. MasSpec Pen analysis of an HGSC tissue sample with mixed histologic composition
(A) Optical image shows the tissue sample that was analyzed at the demarcated regions (1 to 5) using a 1.5-mm-diameter MasSpec Pen. After the MasSpec Pen analysis, the tissue sample was frozen, sectioned, and H&E-stained. An optical image of the H&E-stained tissue section obtained at region 3 is shown (inset), presenting a mixed histologic composition including cancer and adjacent normal stroma tissue. (B) The MasSpec Pen negative ion mode mass spectra are shown for regions 1 (normal stroma; average of n = 3 mass spectra), 3 (mixture of normal stroma and cancer; average of n = 3 mass spectra), and 5 (cancer; average of n = 3 mass spectra). (C) Table listing the pathologic diagnosis of the five regions analyzed and the Lasso prediction results.
Fig. 6
Fig. 6. Intraoperative analysis of tumor and normal tissues in a murine model
(A) Experiments were performed in vivo in mice under anesthesia. Optical images show the animal under anesthesia and before, during, and after the MasSpec Pen analysis. (B) Representative negative ion mode mass spectra show distinct molecular profiles from normal (average of n = 3 mass spectra) and tumor (average of n = 3 mass spectra) tissues.

References

    1. Buchholz TA, Somerfield MR, Griggs JJ, El-Eid S, Hammond MEH, Lyman GH, Mason G, Newman LA. Margins for breast-conserving surgery with whole-breast irradiation in stage I and II invasive breast cancer: American society of clinical oncology endorsement of the society of surgical oncology/american society for radiation oncology consensus guideline. J Clin Oncol. 2014;32:1502–1506. - PubMed
    1. Maygarden SJ, Detterbeck FC, Funkhouser WK. Bronchial margins in lung cancer resection specimens: Utility of frozen section and gross evaluation. Mod Pathol. 2004;17:1080–1086. - PubMed
    1. Massard G, Doddoli C, Gasser B, Ducrocq X, Kessler R, Schumacher C, Jung GM, Wihlm JM. Prognostic implications of a positive bronchial resection margin. Eur J Cardiothorac Surg. 2000;17:557–565. - PubMed
    1. Nick AM, Coleman RL, Ramirez PT, Sood AK. A framework for a personalized surgical approach to ovarian cancer. Nat Rev Clin Oncol. 2015;12:239–245. - PMC - PubMed
    1. Han SS, Jang JY, Kim SW, Kim WH, Lee KU, Park YH. Analysis of long-term survivors after surgical resection for pancreatic cancer. Pancreas. 2006;32:271–275. - PubMed