. 2017 Oct 20;292(42):17258-17271.
doi: 10.1074/jbc.M117.808592. Epub 2017 Sep 6.

Enantiomeric barbiturates bind distinct inter- and intrasubunit binding sites in a nicotinic acetylcholine receptor (nAChR)

Affiliations

Enantiomeric barbiturates bind distinct inter- and intrasubunit binding sites in a nicotinic acetylcholine receptor (nAChR)

Zhiyi Yu et al. J Biol Chem. .

Abstract

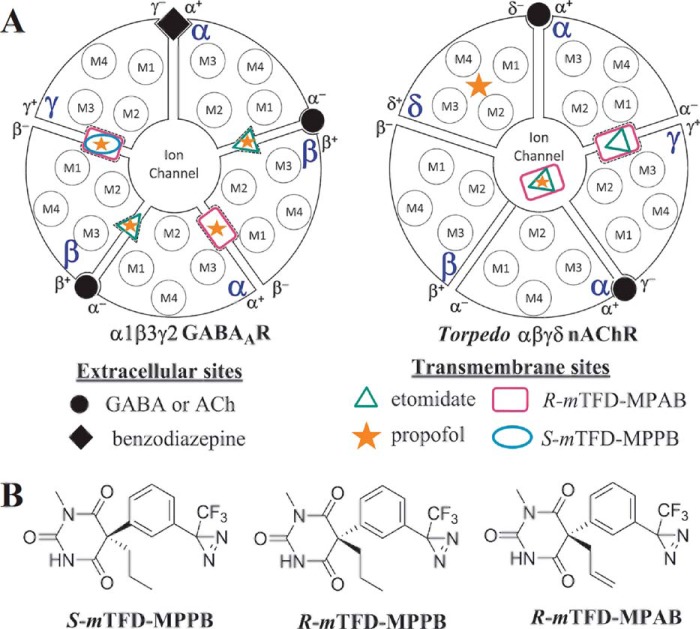
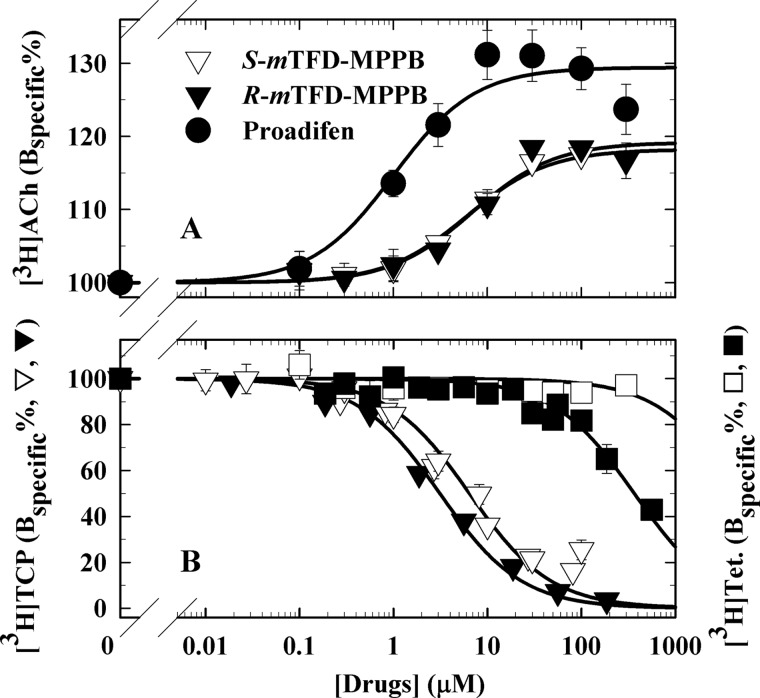
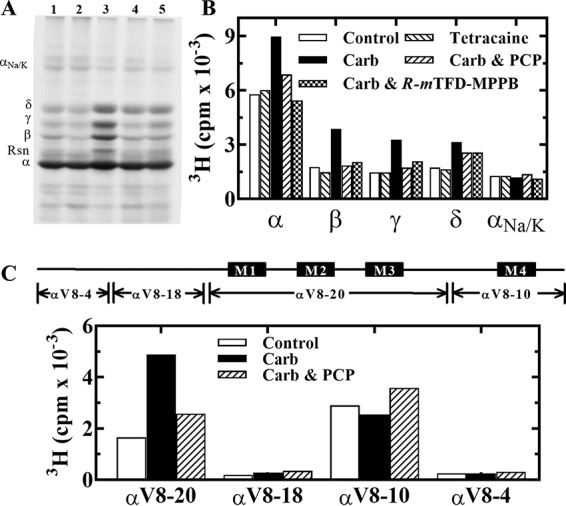
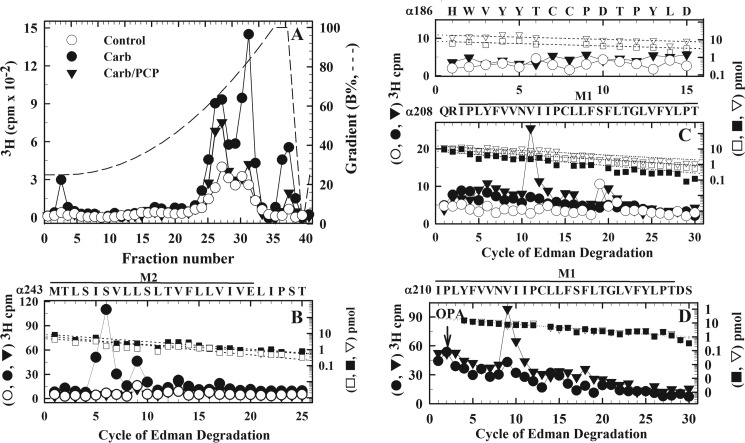
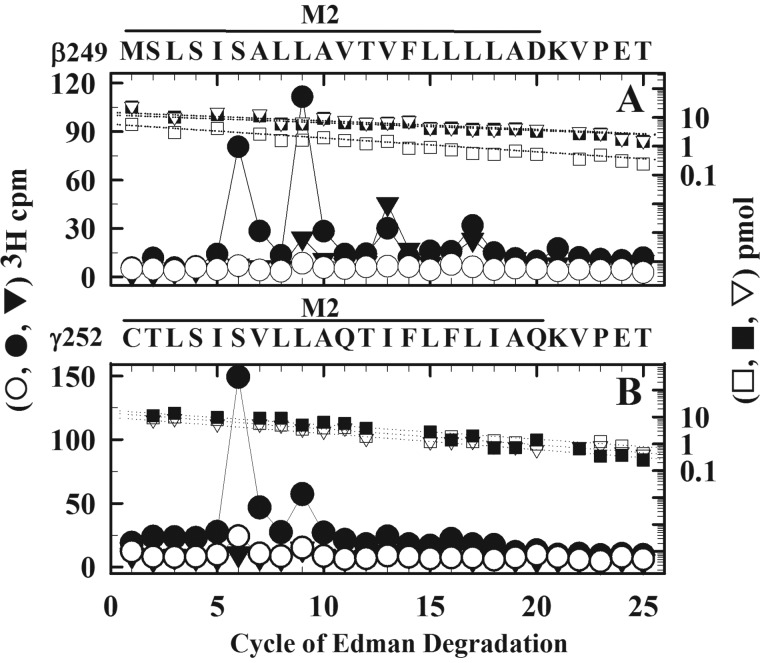
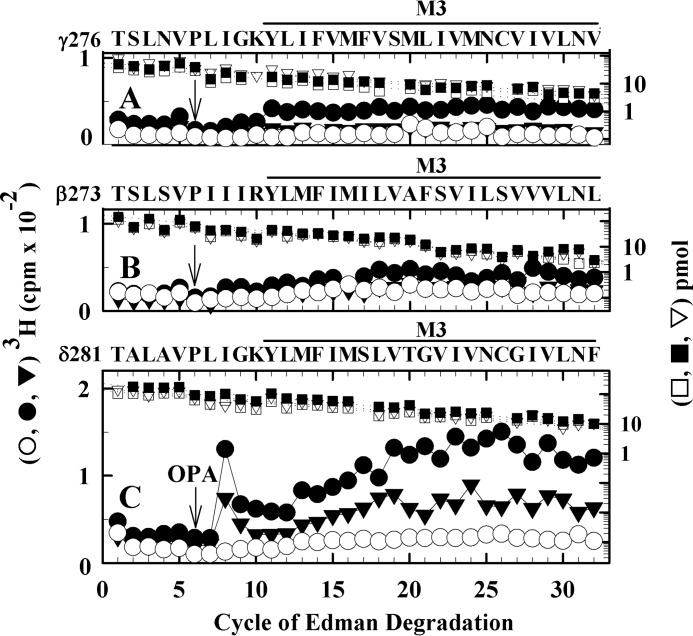
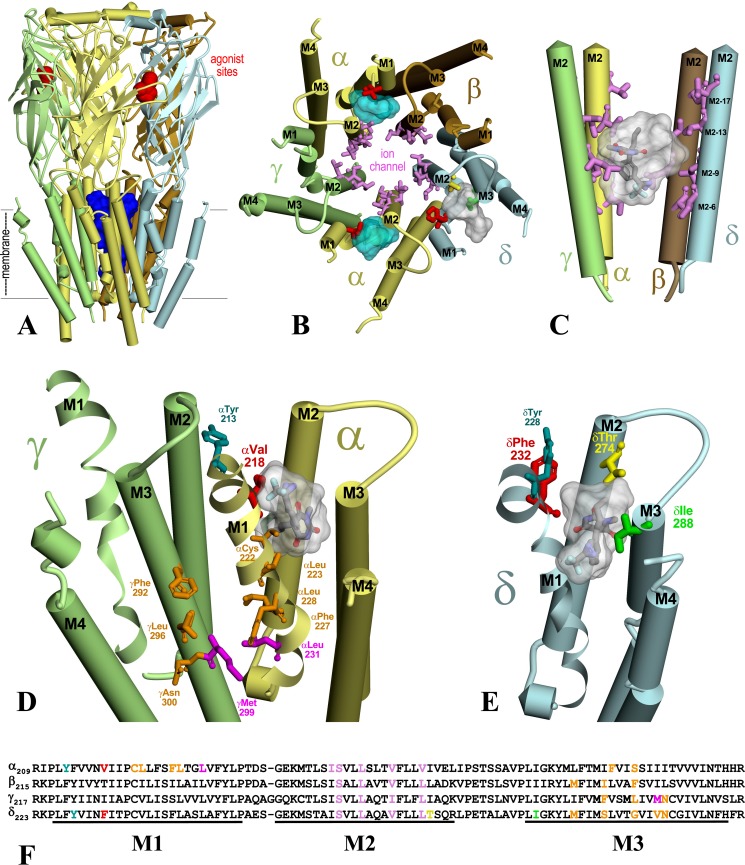
Nicotinic acetylcholine receptors (nAChRs) and γ-aminobutyric acid type A receptors (GABAARs) are members of the pentameric ligand-gated ion channel superfamily. Drugs acting as positive allosteric modulators of muscle-type α2βγδ nAChRs, of use in treatment of neuromuscular disorders, have been hard to identify. However, identification of nAChR allosteric modulator binding sites has been facilitated by using drugs developed as photoreactive GABAAR modulators. Recently, R-1-methyl-5-allyl-5-(m-trifluoromethyl-diazirinylphenyl) barbituric acid (R-mTFD-MPAB), an anesthetic and GABAAR potentiator, has been shown to inhibit Torpedo α2βγδ nAChRs, binding in the ion channel and to a γ+- subunit interface site similar to its GABAAR intersubunit binding site. In contrast, S-1-methyl-5-propyl-5-(m-trifluoromethyl-diazirinylphenyl) barbituric acid (S-mTFD-MPPB) acts as a convulsant and GABAAR inhibitor. Photolabeling studies established that S-mTFD-MPPB binds to the same GABAAR intersubunit binding site as R-mTFD-MPAB, but with negative rather than positive energetic coupling to GABA binding. We now show that S-mTFD-MPPB binds with the same state (agonist) dependence as R-mTFD-MPAB within the nAChR ion channel, but it does not bind to the intersubunit binding site. Rather, S-mTFD-MPPB binds to intrasubunit sites within the α and δ subunits, photolabeling αVal-218 (αM1), δPhe-232 (δM1), δThr-274 (δM2), and δIle-288 (δM3). Propofol, a general anesthetic that binds to GABAAR intersubunit sites, inhibited [3H]S-mTFD-MPPB photolabeling of these nAChR intrasubunit binding sites. These results demonstrate that in an nAChR, the subtle difference in structure between S-mTFD-MPPB and R-mTFD-MPAB (chirality; 5-propyl versus 5-allyl) determines selectivity for intra- versus intersubunit sites, in contrast to GABAARs, where this difference affects state dependence of binding to a common site.

Keywords: GABA receptor; allosteric regulation; anesthetic; nicotinic acetylcholine receptors (nAChR); photoaffinity labeling.


Conflict of interest statement

The authors declare that they have no conflicts of interest with the contents of this article

Figures

Figure 1.
Figure 1.
A, locations of drug-binding sites in an α1β3γ2 GABAAR (left) or Torpedo αβγδ nAChR (right). B, chemical structures of S-mTFD-MPPB, R-mTFD-MPPB, and R-mTFD-MPAB.
Figure 2.
Figure 2.
Effects of S-mTFD-MPPB (▿, □), R-mTFD-MPPB (▾, ■) or proadifen (●) on the equilibrium binding to Torpedo nAChR-rich membranes of [3H]ACh (A) and [3H]TCP (+ Carb) and [3H]tetracaine (+ α-bungarotoxin) (B). Binding assays were performed at 4 °C by centrifugation. Each independent experiment was performed in duplicate, and the data were normalized to the specific binding in the absence of competitor. Pooled data (average ± S.D.) are plotted. See Table 1 for the number of independent experiments and the calculated IC50/EC50 values. For all samples, the final ethanol concentration was 1% (v/v), a concentration that reduced [3H]TCP and [3H]tetracaine binding by <10% and enhanced [3H]ACh binding by <10%. The total control/nonspecific binding were as follows: for [3H]ACh, 2,600/60 cpm; for [3H]TCP, 6,200/1,600 cpm; for [3H]tetracaine, 4,300/1,180 cpm.
Figure 3.
Figure 3.
[3H]S-mTFD-MPPB photoincorporation into Torpedo nAChR-rich membranes. [3H]S-mTFD-MPPB (0.9 μm) was photoincorporated in the absence (control, lane 1) or presence of 100 μm tetracaine (lane 2), 1 mm Carb (lane 3), 1 mm Carb and 100 μm PCP (lane 4), or 1 mm Carb and 60 μm R-mTFD-MPPB (lane 5), and aliquots in duplicate were fractionated by SDS-PAGE. After staining the gel with GelCodeTM Blue Safe Protein Stain, one set was prepared for fluorography (A), and gel bands were excised from the second for 3H determination (B). The electrophoretic mobilities of the nAChR α, β, γ, and δ subunits, rapsyn (Rsn), and the Na+/K+-ATPase α subunit (αNa/K) are indicated on the left of A. C, 3H incorporation in the large nAChR α subunit fragments generated by in-gel digestion of α subunits with V8 protease. Gel bands containing α subunits were isolated by SDS-PAGE from nAChR-rich membranes photolabeled with 1.5 μm [3H]S-mTFD-MPPB in the absence (control) or presence of 1 mm Carb, without or with 100 μm PCP (Carb and Carb/PCP, respectively). The gel bands containing αV8-20, αV8-18, αV8-10, and αV8-4 were excised from the stained mapping gels, and 3H incorporation was determined by liquid scintillation counting.
Figure 4.
Figure 4.
Identification of [3H]S-mTFD-MPPB photolabeled amino acids within αM1 and αM2. nAChR-rich membranes were photolabeled with 0.4 μm [3H]S-mTFD-MPPB in the absence of other drugs (control; ○, □), or in the presence of 1 mm Carb (●, ■) or 1 mm Carb and 100 μm PCP (▾, ▿), and αV8–20 was isolated by in-gel digestion of α subunits with V8 protease. A, 3H elution profiles for EndoLys-C digests of αV8–20 fractionated by rpHPLC. B and C, 3H (control (○), Carb (●), and Carb/PCP (▾)) and PTH-derivatives (control (□), Carb (■), and Carb/PCP (▿)) released during sequence analysis of fragments containing αM2 (B) and αM1 (C) from rpHPLC fractions 30–32 and 25–28, respectively. B, when sequencing the fragment beginning at αMet-243 (I0 = 5 (□), 9 (■), and 7 (▿) pmol), the major peak of 3H release in cycle 6 indicates photolabeling in the presence Carb of αSer-248 (αM2-6′), with lower-level labeling of αM2-5′, -9′, -13′, and -17′. For this sample, the efficiencies of photolabeling of αSer-248 were 51 cpm/pmol (Carb), 3 cpm/pmol (control), and 1.8 cpm/pmol (Carb/PCP). C, top, no peaks of 3H release were detected when the fragment beginning at αHis-186 (I0 = 8 (□) and 19 (▿) pmol) was sequenced for 15 cycles. The sequencing filters were then treated with CNBr to cleave at αMet-207. C, bottom, when sequencing was continued from αGln-208 (I0 = 10 (□), 7 (■), and 16 (▿) pmol), the peak of 3H release in cycle 11 was consistent with photolabeling of αVal-218 at efficiencies of <0.2 cpm/pmol (control), 1.6 cpm/pmol (Carb), and 5 cpm/pmol (Carb/PCP). D, 3H (Carb (●) and Carb/PCP (▾)) and PTH-derivatives (Carb (■) and Carb/PCP (▿)) released during sequence analysis of a fragment beginning at αIle-210 (I0 = 22 pmol, both conditions) isolated by rpHPLC from trypsin digests of α subunits from an independent photolabeling of nAChR-rich membranes with 0.4 μm [3H]S-mTFD-MPPB in the presence of 1 mm Carb without or with 100 μm PCP. Sequencing filters were treated with OPA at cycle 2 to prevent further sequencing of any fragments not containing a proline in that cycle. The peak of 3H release in cycle 9 confirmed photolabeling of αVal-218 at efficiencies of 3 cpm/pmol (Carb) and 12 cpm/pmol (Carb/PCP).
Figure 5.
Figure 5.
Identification of [3H]S-mTFD-MPPB photolabeled amino acids within δM1 and δM2. EndoLys-C digests of δ subunits from the photolabeling experiment of Fig. 4 were fractionated by Tricine SDS-PAGE. A, 3H (control (○), Carb (●), and Carb/PCP (▾)) elution profile when material from an ∼13-kDa gel band was further fractionated by rpHPLC. B and C, 3H (Control (○), Carb (●), and Carb/PCP (▾)) and PTH-derivatives (control (□), Carb (■), and Carb/PCP (▿)) released during sequence analysis of fragments containing δM2 (B) and δM1 (C) from rpHPLC fractions 27–29 and 23–25, respectively. B, when sequencing the fragment beginning at δMet-257 (I0 = 90 pmol, each condition), the major peak of 3H release in cycle 9 indicated photolabeling in the presence of Carb of δLeu-265 (δM2-9′), with lower level labeling of δM2-6′, -13′, -17′, and -18′. The efficiencies of δLeu-265 photolabeling were 26 cpm/pmol (Carb), 3 cpm/pmol (control), and 10 cpm/pmol (Carb/PCP). C, when sequencing the fragment beginning at δPhe-206 (I0 = 32 pmol, each condition), the peak of 3H release at cycle 27 indicated photolabeling of δPhe-232 at efficiencies of <0.2 cpm/pmol (control), 6 cpm/pmol (Carb), and 10 cpm/pmol (Carb/PCP). The small peak of 3H release at cycle 9 (Carb) is consistent with photolabeling of δM2-9′ in the fragment beginning at δMet-257, which was present at ∼5% the level of the δPhe-206 fragment.
Figure 6.
Figure 6.
Propofol inhibits [3H]S-mTFD-MPPB photolabeling in αM1 (αVal-218), δM1 (δPhe-232), and δM2. Fragments containing αM1 (A), δM1 (B), and δM2 (C) were isolated for sequence analysis from nAChR-rich membranes photolabeled with 0.4 μm [3H]S-mTFD-MPPB in the presence of 1 mm Carb + 100 μm PCP (▾, ▿) or 1 mm Carb + 100 μm PCP + 100 μm propofol (♦, ♢). Shown are 3H (▾, ♦) and PTH-derivatives (▿, ♢) released during sequence analysis of fragments beginning at αIle-210 (A, I0 = 50 pmol, each condition, sequencing filters treated with OPA at cycle 2), δPhe-206 (B, I0 = 45 pmol, each condition), and δMet-257 (C, I0 = 100 pmol, each condition). The peaks of 3H release in cycles 9 (A) and 27 (B) indicated photolabeling of αVal-218 at 1.7 cpm/pmol (Carb/PCP) and 0.3 cpm/pmol (Carb/PCP/propofol) and of δPhe-232 at 2 cpm/pmol (Carb/PCP) and 0.8 cpm/pmol (Carb/PCP/propofol). C, the peaks of 3H release at cycles 9, 13, 17, and 18 indicated photolabeling of ion channel residues δM2-9′, -13′, and -17′ and of δThr-274 in the δ helix bundle, with propofol inhibiting photolabeling by 60–80%.
Figure 7.
Figure 7.
Agonist-enhanced and PCP-inhibitable [3H]S-mTFD-MPPB photolabeling within βM2 (A) and γM2 (B) helices. 3H (control (○), Carb (●), and Carb/PCP (▾)) and PTH-derivatives (control (□), Carb (■), and Carb/PCP (▿)) released during sequencing are shown for fragments isolated from β and γ subunits from the photolabeling experiment of Fig. 5. The fragment beginning at βMet-249 was isolated by Tricine SDS-PAGE and rpHPLC from β subunit trypsin digests. The fragment beginning at γCys-252 was isolated by rpHPLC from an EndoLys-C digest of ∼14-kDa fragments produced by in-gel digestion of γ subunit with V8 protease. A, for the fragment beginning at βMet-249 (I0 = 6 (□), 12 (■), and 15 (▿) pmol), the major peaks of 3H release in cycles 6 and 9 (Carb) indicate photolabeling of βM2-6′ (βSer-254) and βM2-9′ (βLeu-257) with lower-level labeling at βM2-13′ and βM2-17′. The efficiencies of photolabeling for control/Carb/Carb + PCP were as follows: for βM2–6′, 2/15/0.6 cpm/pmol; for βM2-9′, 6/28/5 cpm/pmol. B, for the fragment beginning at γCys-252 (I0 = 14 (□), 17 (■), and 10 (▿) pmol), the peak of 3H release at cycle 6 in B indicates photolabeling of γM2-6′ (γSer-257) at 4.7 cpm/pmol (control), 29 cpm/pmol (Carb), and 1.4 cpm/pmol (Carb/PCP).
Figure 8.
Figure 8.
[3H]S-mTFD-MPPB photolabels δIle-288 without labeling other residues within γM3 (A), βM3 (B), or δM3 (C) helices. 3H (control (○), Carb (●), and Carb/PCP (▾)) and PTH-derivatives (control (□), Carb (■), and Carb/PCP (▿)) released during sequencing are shown for fragments isolated by rpHPLC from V8 protease digests of nAChR β, γ, and δ subunits from the photolabeling experiment of Fig. 5. The major peaks of 3H from the rpHPLC fractionations of the subunit digests were sequenced with OPA treatment at cycle 6 of Edman degradation (indicated by the arrows), which prevents further sequencing of peptides not containing a proline at this cycle and chemically isolates the fragments beginning at γThr-276, βThr-273, and δThr-281. A, after OPA treatment, sequencing continued for the fragment beginning at γThr-276 (I0 = 38 (□) and 55 (■, ▿) pmol). B, after OPA treatment, sequencing continued of the fragment beginning at βThr-273 (I0 = 110 (□, ▿) and 170 (■) pmol). No evidence was seen for labeling in γM3 or βM3, based upon the absence of any peaks of 3H release >25% above the background level of release. C, after OPA treatment, sequencing continued for the fragment beginning at δThr-281 (I0 = 140 (□, ▿) and 220 (■) pmol). The peak of 3H release at cycle 8 in C indicated photolabeling of δIle-288 at <0.2 cpm/pmol (control), 2.0 cpm/pmol (Carb), and 1.5 cpm/pmol (Carb/PCP). The progressive increase in background 3H release in cycles 13–32 of Edman degradation results from random cleavages of other fragments in the sequenced sample that contain residues labeled in δM2 and δM1. Although present, sequencing of those fragments was prevented by treatment of the sequencing filters with OPA in cycle 6, which blocks further sequencing of peptides not containing a proline at that cycle (44, 54).
Figure 9.
Figure 9.
[3H]S-mTFD-MPPB photolabels αCys-412 in αM4. 3H (control (○), Carb (●), and Carb/PCP (▾)) and PTH-derivatives (control (□), Carb (■), and Carb/PCP (▿)) released during sequencing are shown for the fragment beginning at αTyr-401 ((I0 = 16 (□, ■) and 8 (▿) pmol) isolated by rpHPLC from a trypsin digest of αV8-10 from the photolabeling experiment of Fig. 5. The peak of 3H release at cycle 12 indicates photolabeling of αCys-412 at efficiencies of 50 cpm/pmol (control and Carb) and 70 cpm/pmol (Carb/PCP).
Figure 10.
Figure 10.
S-mTFD-MPPB binding sites in the Torpedo nAChR. A T. californica nAChR homology model was constructed based on the crystal structure of human (α4)2(β2)3 nAChR (Protein Data Bank entry 5KXI (16)). A, side view of the nAChR extracellular and transmembrane domains (α (yellow), β (brown), γ (green), and δ (light blue)) with nicotine (red Connolly surface) in the ACh-binding sites and the ion channel in blue. B, a view of the nAChR TMD from the base of the extracellular domain. C, the binding site in the ion channel. D and E, views from the lipid of the γ–α subunit interface (D) and the δ subunit TMD (E), at a tilt angle optimizing visualization of the α and δ subunit helix bundle pockets. The amino acids photolabeled by [3H]S-mTFD-MPPB are shown in stick representation in the ion channel (B and C; pink), in the α subunit helix bundle (B and D; αVal-218 (red)), and in the δ subunit helix bundle (B and E; δPhe-232 (red), δThr-274 (yellow), and δIle-288 (green)). In C–E, the locations of S-mTFD-MPPB (molecular volume = 269 Å3) docked in the binding sites are shown in stick representations (carbon (gray), hydrogen (white), oxygen (red), nitrogen (blue), and fluorine (cyan)) in the most favorable binding mode and/or as Connolly surface representations of the volumes defined by the ensemble of the 10 most energetically favorable binding poses. Also highlighted in D and E are the amino acids photolabeled by [3H]R-mTFD-MPAB (magenta, αLeu-231 and γMet-299 (26)) at the γ–α interface, by [14C]halothane (teal, αTyr-213 and δTyr-228 (43)) in the helix bundle pockets, and by [125I]TID (orange, αCys-222, αLeu-223, αPhe-227, αLeu-228, γPhe-292, γLeu-296, and γAsn-300) at the lipid interface. F, subunit sequence alignment for the M1–M3 region, with the same color coding of amino acids as shown in B–E to identify photolabeled residues.

References

    1. Changeux J. P. (2012) The nicotinic acetylcholine receptor: the founding father of the pentameric ligand-gated ion channel superfamily. J. Biol. Chem. 287, 40207–40215 - PMC - PubMed
    1. Sigel E., and Steinmann M. E. (2012) Structure, function, and modulation of GABAA receptors. J. Biol. Chem. 287, 40224–40231 - PMC - PubMed
    1. Dutertre S., Becker C. M., and Betz H. (2012) Inhibitory glycine receptors: an update. J. Biol. Chem. 287, 40216–40223 - PMC - PubMed
    1. Lummis S. C. R. (2012) 5-HT3 receptors. J. Biol. Chem. 287, 40239–40245 - PMC - PubMed
    1. Wolstenholme A. J. (2012) Glutamate-gated chloride channels. J. Biol. Chem. 287, 40232–40238 - PMC - PubMed

Publication types

Associated data

LinkOut - more resources