. 2017 Sep 26;114(39):E8214-E8223.
doi: 10.1073/pnas.1710430114. Epub 2017 Sep 6.

Drusen in patient-derived hiPSC-RPE models of macular dystrophies

Affiliations

Drusen in patient-derived hiPSC-RPE models of macular dystrophies

Chad A Galloway et al. Proc Natl Acad Sci U S A. .

Abstract

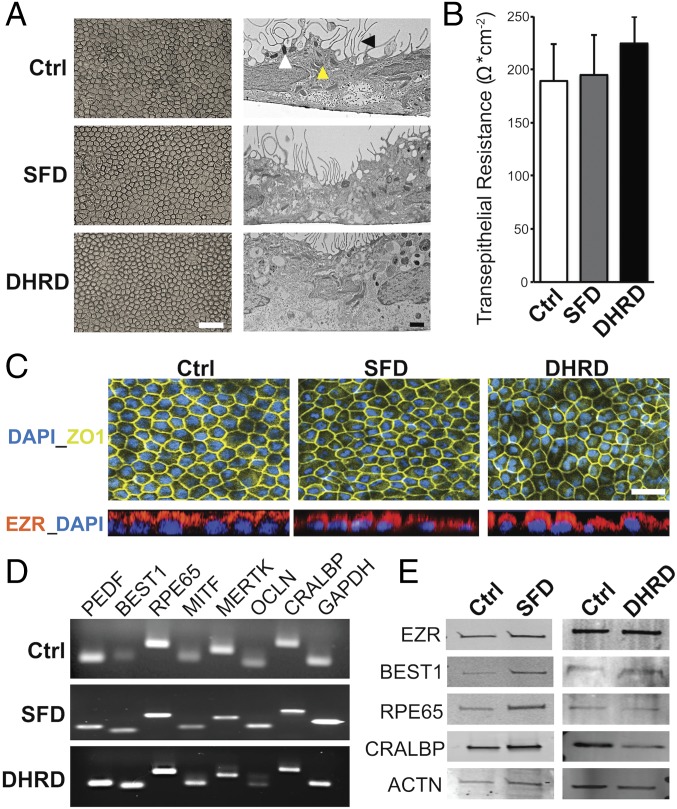
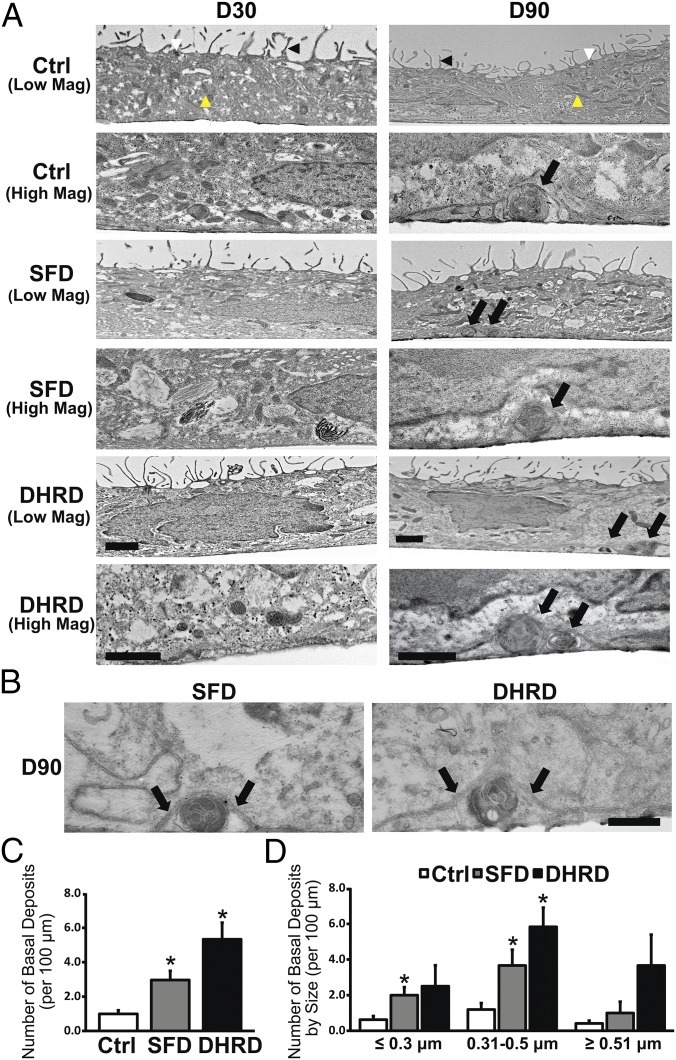
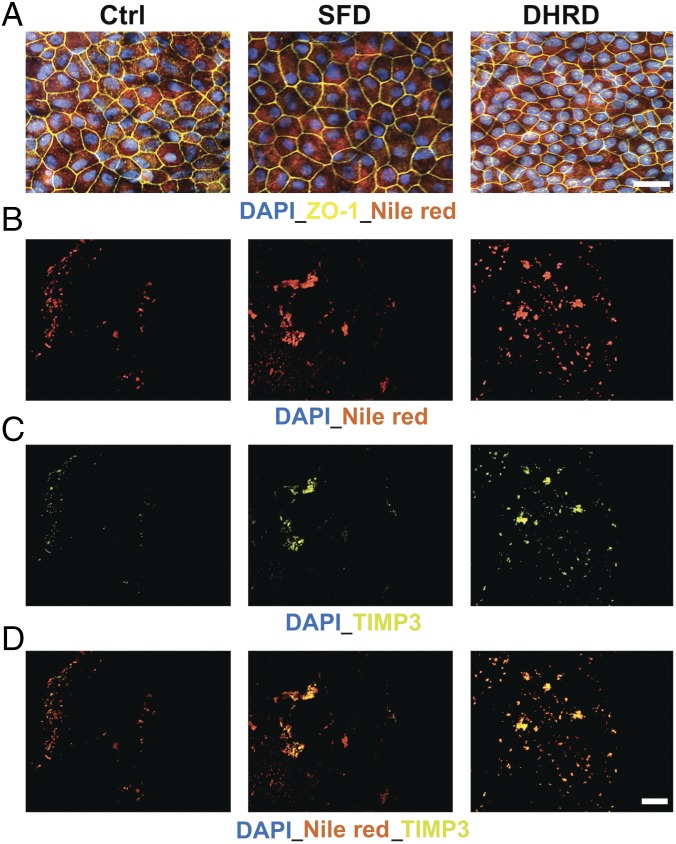
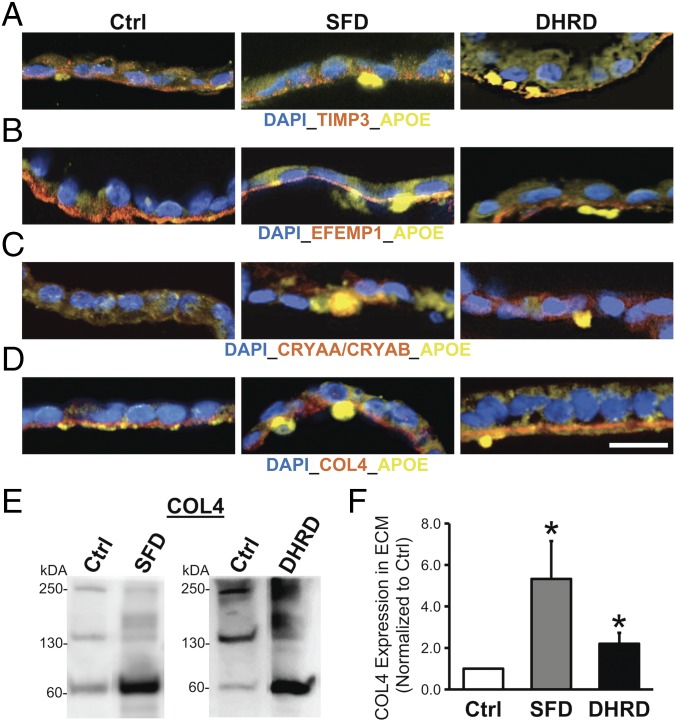
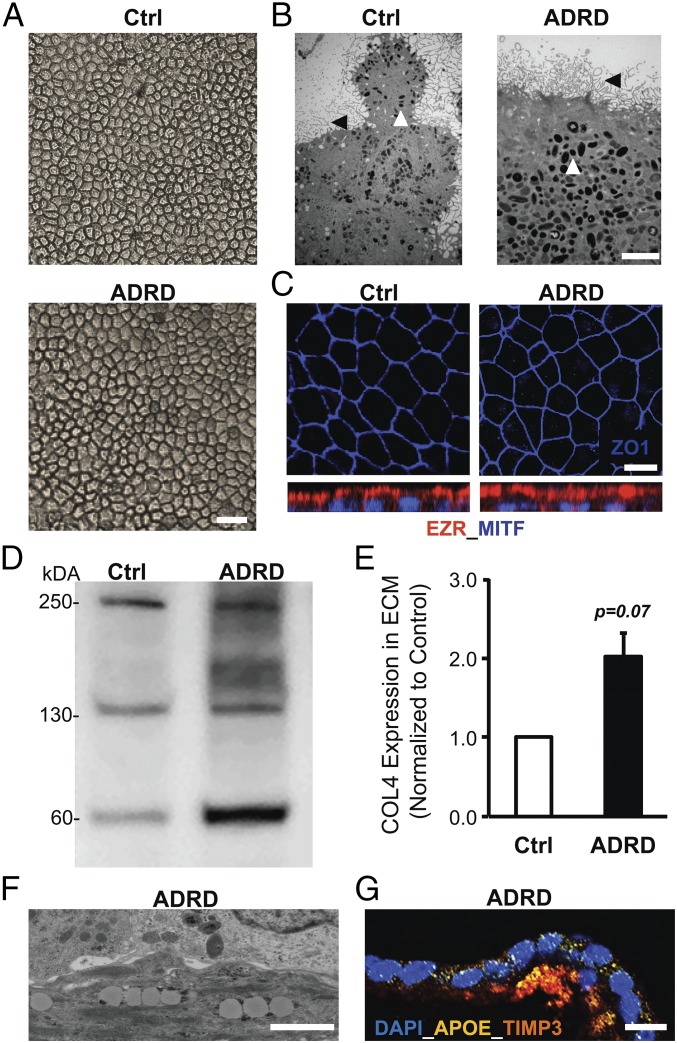
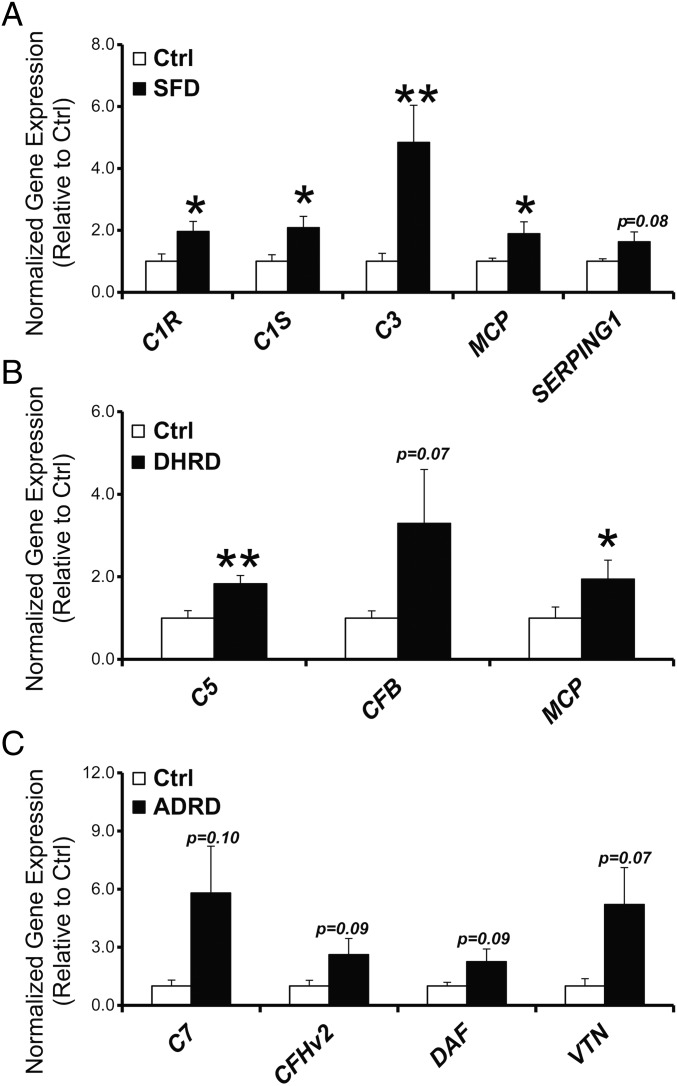
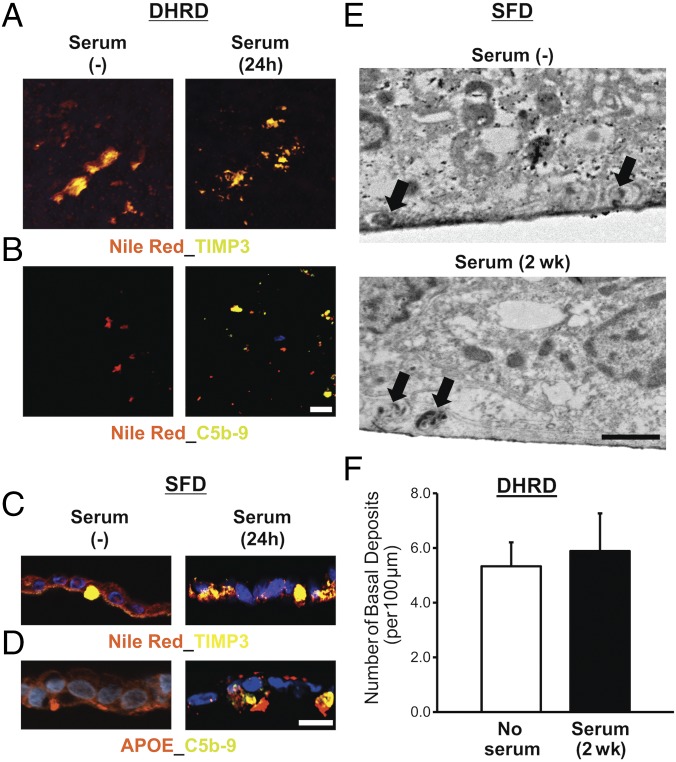
Age-related macular degeneration (AMD) and related macular dystrophies (MDs) are a major cause of vision loss. However, the mechanisms underlying their progression remain ill-defined. This is partly due to the lack of disease models recapitulating the human pathology. Furthermore, in vivo studies have yielded limited understanding of the role of specific cell types in the eye vs. systemic influences (e.g., serum) on the disease pathology. Here, we use human induced pluripotent stem cell-retinal pigment epithelium (hiPSC-RPE) derived from patients with three dominant MDs, Sorsby's fundus dystrophy (SFD), Doyne honeycomb retinal dystrophy/malattia Leventinese (DHRD), and autosomal dominant radial drusen (ADRD), and demonstrate that dysfunction of RPE cells alone is sufficient for the initiation of sub-RPE lipoproteinaceous deposit (drusen) formation and extracellular matrix (ECM) alteration in these diseases. Consistent with clinical studies, sub-RPE basal deposits were present beneath both control (unaffected) and patient hiPSC-RPE cells. Importantly basal deposits in patient hiPSC-RPE cultures were more abundant and displayed a lipid- and protein-rich "drusen-like" composition. Furthermore, increased accumulation of COL4 was observed in ECM isolated from control vs. patient hiPSC-RPE cultures. Interestingly, RPE-specific up-regulation in the expression of several complement genes was also seen in patient hiPSC-RPE cultures of all three MDs (SFD, DHRD, and ADRD). Finally, although serum exposure was not necessary for drusen formation, COL4 accumulation in ECM, and complement pathway gene alteration, it impacted the composition of drusen-like deposits in patient hiPSC-RPE cultures. Together, the drusen model(s) of MDs described here provide fundamental insights into the unique biology of maculopathies affecting the RPE-ECM interface.

Keywords: drusen; human induced pluripotent stem cells; macular dystrophies; retinal pigment epithelium; sub-RPE deposits.


Conflict of interest statement

The authors declare no conflict of interest.

Figures

Fig. 1.
Fig. 1.
No difference in baseline RPE characteristics were seen in Ctrl, SFD, and DHRD hiPSC-RPE at D90 in culture. (A) Light and electron microscopy images of D90 SFD, DHRD, and Ctrl hiPSC-RPE cultures grown on Transwell inserts (Corning) showed the characteristic cobblestone RPE morphology, apical microvilli (black arrowhead), melanosomes (white arrowhead), and mitochondria (yellow arrowhead). (Scale bars: 50 μm, Left; 1 μm, Right.) (B) Transepithelial resistance measurement of D90 SFD, DHRD, and Ctrl hiPSC-RPE cultures was comparable to the proposed in vivo threshold, 150 Ω·cm−2 (31). Data are expressed as mean + SEM. (C) Immunocytochemical analyses demonstrated RPE-specific morphology, i.e., tight junction formation (ZO-1) and proper polarization (EZR: Apical), of cultured SFD, DHRD, and Ctrl hiPSC-RPE at D90. (Scale bar: 50 μm.) (D and E) RT-PCR (D) and Western blot (E) analyses showed robust expression of RPE characteristic genes and proteins in D90 hiPSC-RPE derived from SFD, DHRD, and Ctrl hiPSCs. GAPDH and ACTN served as loading controls in RT-PCR and Western blotting analysis, respectively. Note: The color palette in confocal images throughout the article has been altered to accommodate colorblind readers.
Fig. 2.
Fig. 2.
Increased number of basal deposits underlying aged (D90) Ctrl vs. SFD and DHRD hiPSC-RPE cultures. (A) Transmission electron microscopy (TEM) analyses showed cellular features consistent with RPE cells, i.e., apical microvilli (black arrowhead), melanosomes (white arrowhead), and mitochondria (yellow arrowhead), in both D30 (Left) and D90 (Right) Ctrl, SFD, and DHRD hiPSC-RPE cultures. No sub-RPE basal deposits were seen in Ctrl, SFD, and DHRD hiPSC-RPE cells at D30 (Left). In contrast, Ctrl, SFD, and DHRD hiPSC-RPE cultures at D90 in culture exhibited basal deposits (black arrows, Right). (Scale bars: 1 μm.) (B) Higher-magnification TEM images further demonstrated membrane-displacing basal deposits in SFD and DHRD hiPSC-RPE cultures (the basement membrane is indicated by black arrows). (Scale bar: 200 nm.) (C) Quantification of the total number of basal deposits confirmed an increased number of basal deposits in D90 SFD and DHRD hiPSC-RPE cultures compared with age-matched Ctrl hiPSC-RPE cultures. (D) Quantification and characterization of basal deposits by diameter demonstrated basal deposits in three distinct size ranges: ≤0.3 μm, 0.31–0.5 μm, and ≥0.51 μm in Ctrl, DHRD, and SFD hiPSC-RPE cultures. Furthermore, deposits ≤0.3 μm and/or 0.31–0.5 μm were more abundant in SFD and DHRD hiPSC-RPE cultures compared with Ctrl hiPSC-RPE cultures. Data are presented as mean + SEM. *P < 0.05.
Fig. 3.
Fig. 3.
Transwell membranes underneath aged (D90) SFD and DHRD hiPSC-RPE show deposition of Nile red-stained TIMP3 containing lipid–protein complexes. (A) Nile red staining demonstrated uniform intracellular expression of neutral lipids in D90 Ctrl, DHRD, and SFD hiPSC-RPE. (Scale bar: 50 μm.) (BD) Immunostaining of Transwell membranes after removal of the D90 hiPSC-RPE monolayer showed increased sub-RPE deposition of neutral lipids (B), TIMP3 (C), and colocalized neutral lipid-TIMP3 complexes (D) on the surface of Transwell membranes underlying patient SFD and DHRD hiPSC-RPE cultures compared with Ctrl hiPSC-RPE cultures. (Scale bar: 50 μm.) Of note, confocal images from the same experiment showing the same Transwell membrane are shown in BD to emphasize the almost complete colocalization of TIMP3 and Nile red staining in sub-RPE deposits on Transwell membranes underlying SFD and DHRD hiPSC-RPE cultures.
Fig. 4.
Fig. 4.
Presence of sub-RPE deposits with drusen-like composition underneath aged (D90) SFD and DHRD hiPSC-RPE cultures. (AD) Confocal images of age-matched (D90) Ctrl vs. SFD and DHRD hiPSC-RPE cross-sections displayed the presence of TIMP3-APOE–positive (A), EFEMP1-APOE–positive (B), CRYAA/CRYAB-APOE–positive (C), and APOE-positive deposits underlying basement membrane marked by COL4 (D) in SFD and DHRD hiPSC-RPE cultures. (Scale bar: 25 µm.) Of note, sporadic APOE-positive sub-RPE basal deposits (A and D) were observed underneath Ctrl hiPSC-RPE cultures. (E and F) Quantitative Western blot analyses revealed increased amount of COL4 protein in the ECM underlying SFD and DHRD hiPSC-RPE cultures compared with Ctrl hiPSC-RPE cultures at D90. Of note, data are presented as mean + SEM, and COL4 bands at ∼250, 150, and 70 kDa are consistent with multimeric and monomeric α1 and α2 subunits and fragments of human COL4 protein. *P ≤ 0.05.
Fig. 5.
Fig. 5.
Increased accumulation of COL4 in ECM and the presence of TIMP3-APOE–positive deposits in aged (D90) ADRD hiPSC-RPE cultures. (A and B) Light microscopy (A) and electron microscopy (B) analysis at D90 showed similar cobblestone morphology in Ctrl vs. ADRD hiPSC-RPE cultures. Apical microvilli (black arrowhead), and melanosomes (white arrowhead) are seen in Ctrl vs. ADRD hiPSC-RPE cultures. (Scale bars: 100 µm in A; 5 µm in B.) (C) Immunocytochemical analyses demonstrated similar localization of the tight junction protein ZO-1 and the apical RPE cell marker EZR in Ctrl and ADRD hiPSC-RPE at D90. (Scale bar: 10 μm.) (D and E) Quantitative Western blot analyses demonstrated higher levels of COL4 protein in the ECM underlying Ctrl vs. ADRD hiPSC-RPE cultures at D90. Of note, data are presented as mean + SEM in the bar graph. Furthermore, COL4 bands at ∼250, 150, and 70 kDa are consistent with multi- and monomeric α1, α2 subunits and fragments of the human COL4 protein. (F and G) Electron microscopy (F) and immunocytochemical (G) analyses revealed lipid droplet accumulation and TIMP3-APOE–positive sub-RPE deposits in D90 ADRD hiPSC-RPE cultures. (Scale bars: 1 µm in F and 50 µm in G.)
Fig. 6.
Fig. 6.
Increased expression of complement pathway genes in ADRD, SFD, and DHRD compared with Ctrl hiPSC-RPE monoculture at D90. (AC) Quantitative real-time PCR analysis demonstrated increased expression of several complement pathway genes in SFD (A), DHRD (B), and ADRD (C) hiPSC-RPE cultures at D90 compared with age-matched Ctrl hiPSC-RPE. Data are presented as mean + SEM. *P < 0.05, **P < 0.005.
Fig. 7.
Fig. 7.
Serum supplementation affects the composition of sub-RPE deposits in aged (D90) patient-derived hiPSC-RPE cultures. (A) Confocal microscopy after immunocytochemical analyses showed similar sub-RPE deposition of colocalized neutral lipid–TIMP3 complexes on the surface of Transwell membranes underlying the DHRD hiPSC-RPE (D90) monolayer in untreated vs. serum-treated (10%, 24-h) cultures. (B) Confocal microscopy demonstrated deposition of complement proteins C5b-9 in conjunction with neutral lipids after supplementation of D90 DHRD hiPSC-RPE cultures with 10% serum for 24 h. [Scale bar (applies also to A): 50 µm.] (C) Immunocytochemical analyses of D90 SFD hiPSC-RPE cross-sections after serum supplementation (10%, 24 h) in culture medium demonstrated the presence of Nile red-, TIMP3-positive deposits in both untreated and serum-treated SFD hiPSC-RPE cultures. (D) Immunostaining of D90 SFD hiPSC-RPE cross-sections showed selective deposition of C5b-9 complex with APOE-positive sub-RPE deposits in serum-treated (10%, 24 h) compared with untreated SFD hiPSC-RPE cultures. (E and F) Electron microscopy analyses showed similar numbers of basal deposits (black arrows) in both untreated and serum-treated SFD (E) and DHRD (F) hiPSC-RPE cultures after chronic serum supplementation (10%, 2 wk). Data are presented as mean + SEM. (Scale bar in E: 1 µm.)

References

    1. Capon MR, et al. Sorsby’s fundus dystrophy. A light and electron microscopic study. Ophthalmology. 1989;96:1769–1777. - PubMed
    1. Marmorstein LY, et al. Aberrant accumulation of EFEMP1 underlies drusen formation in Malattia Leventinese and age-related macular degeneration. Proc Natl Acad Sci USA. 2002;99:13067–13072. - PMC - PubMed
    1. Green WR. Histopathology of age-related macular degeneration. Mol Vis. 1999;5:27. - PubMed
    1. Young RW. Pathophysiology of age-related macular degeneration. Surv Ophthalmol. 1987;31:291–306. - PubMed
    1. Fariss RN, Apte SS, Luthert PJ, Bird AC, Milam AH. Accumulation of tissue inhibitor of metalloproteinases-3 in human eyes with Sorsby's fundus dystrophy or retinitis pigmentosa. Br J Ophthalmol. 1998;82:1329–1334. - PMC - PubMed

Publication types

MeSH terms

Supplementary concepts