. 2017 Oct 27;91(22):e01219-17.
doi: 10.1128/JVI.01219-17. Print 2017 Nov 15.

IRF9 Prevents CD8+ T Cell Exhaustion in an Extrinsic Manner during Acute Lymphocytic Choriomeningitis Virus Infection

Affiliations

IRF9 Prevents CD8+ T Cell Exhaustion in an Extrinsic Manner during Acute Lymphocytic Choriomeningitis Virus Infection

Magdalena Huber et al. J Virol. .

Abstract

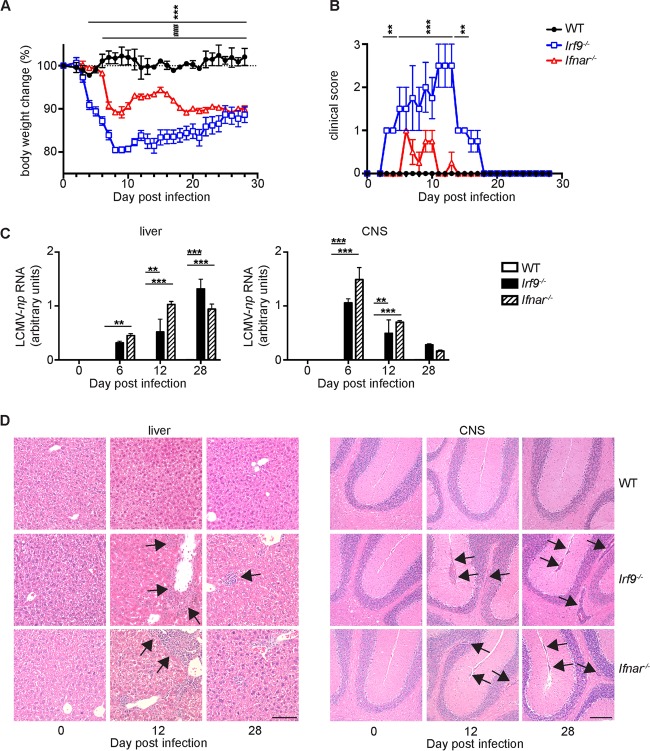
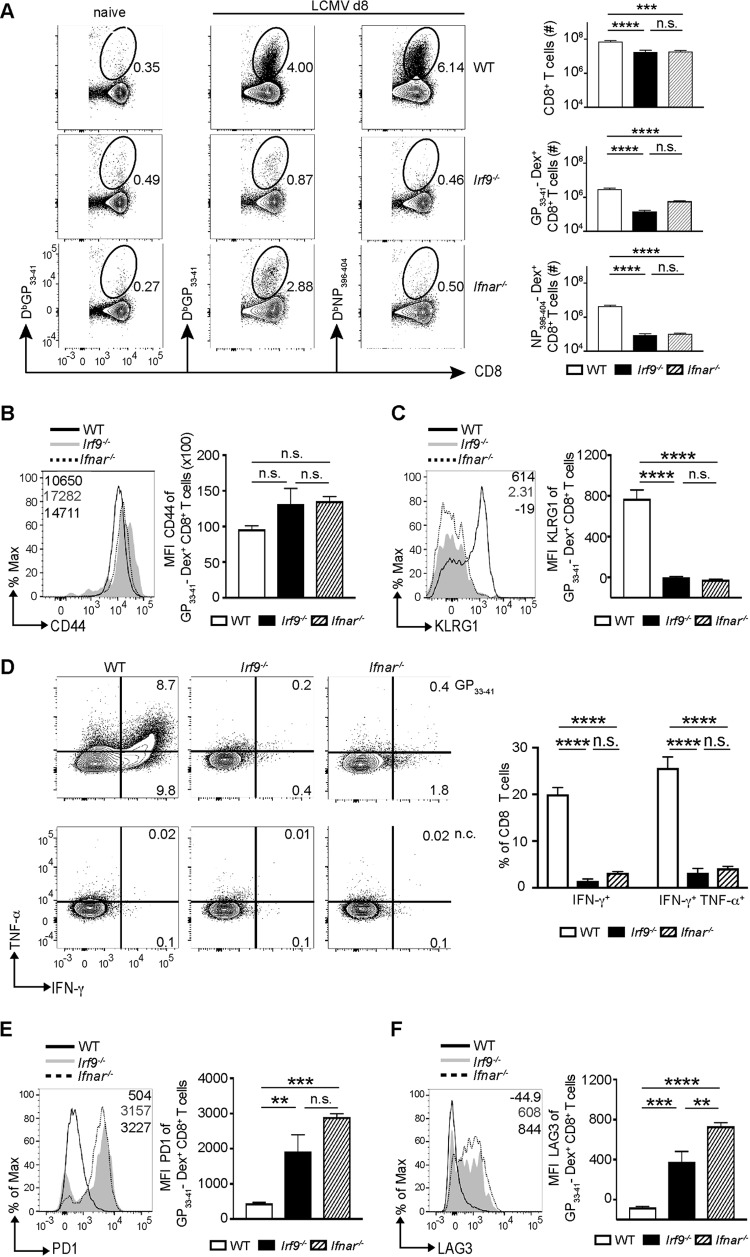
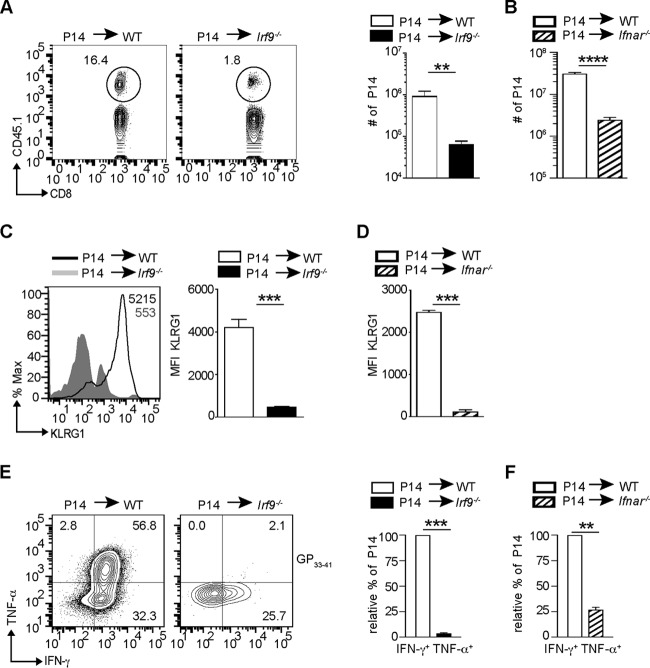
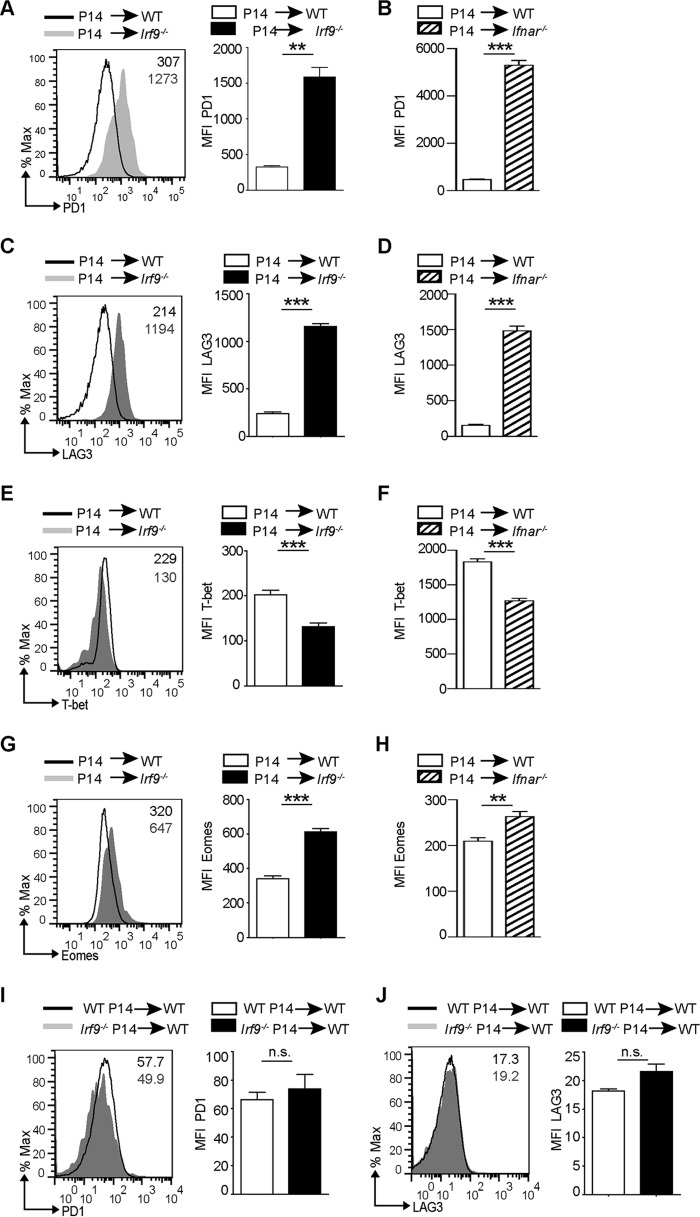
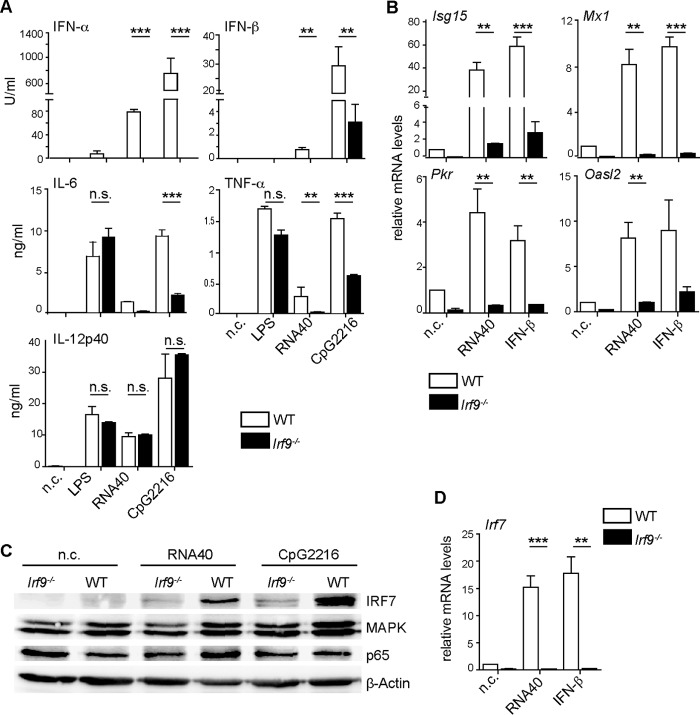
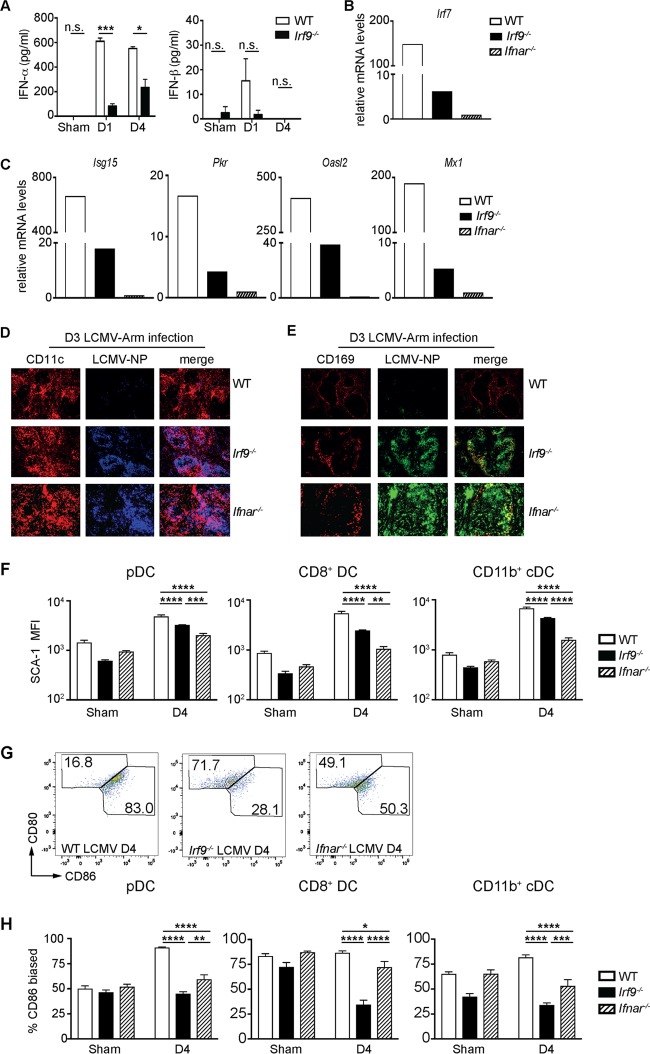
Effective CD8+ T cell responses play an important role in determining the course of a viral infection. Overwhelming antigen exposure can result in suboptimal CD8+ T cell responses, leading to chronic infection. This altered CD8+ T cell differentiation state, termed exhaustion, is characterized by reduced effector function, upregulation of inhibitory receptors, and altered expression of transcription factors. Prevention of overwhelming antigen exposure to limit CD8+ T cell exhaustion is of significant interest for the control of chronic infection. The transcription factor interferon regulatory factor 9 (IRF9) is a component of type I interferon (IFN-I) signaling downstream of the IFN-I receptor (IFNAR). Using acute infection of mice with lymphocytic choriomeningitis virus (LCMV) strain Armstrong, we show here that IRF9 limited early LCMV replication by regulating expression of interferon-stimulated genes and IFN-I and by controlling levels of IRF7, a transcription factor essential for IFN-I production. Infection of IRF9- or IFNAR-deficient mice led to a loss of early restriction of viral replication and impaired antiviral responses in dendritic cells, resulting in CD8+ T cell exhaustion and chronic infection. Differences in the antiviral activities of IRF9- and IFNAR-deficient mice and dendritic cells provided further evidence of IRF9-independent IFN-I signaling. Thus, our findings illustrate a CD8+ T cell-extrinsic function for IRF9, as a signaling factor downstream of IFNAR, in preventing overwhelming antigen exposure resulting in CD8+ T cell exhaustion and, ultimately, chronic infection.IMPORTANCE During early viral infection, overwhelming antigen exposure can cause functional exhaustion of CD8+ T cells and lead to chronic infection. Here we show that the transcription factor interferon regulatory factor 9 (IRF9) plays a decisive role in preventing CD8+ T cell exhaustion. Using acute infection of mice with LCMV strain Armstrong, we found that IRF9 limited early LCMV replication by regulating expression of interferon-stimulated genes and Irf7, encoding a transcription factor crucial for type I interferon (IFN-I) production, as well as by controlling the levels of IFN-I. Infection of IRF9-deficient mice led to a chronic infection that was accompanied by CD8+ T cell exhaustion due to defects extrinsic to T cells. Our findings illustrate an essential role for IRF9, as a mediator downstream of IFNAR, in preventing overwhelming antigen exposure causing CD8+ T cell exhaustion and leading to chronic viral infection.

Keywords: CD8+ T cell exhaustion; interferon regulatory factor 9; lymphocytic choriomeningitis virus; type I interferon.


Figures

FIG 1
FIG 1
IRF9 deficiency converts acute LCMV-Arm infection into a chronic infection associated with inflammatory changes. (A to D) WT, Irf9−/−, and Ifnar−/− mice were infected with LCMV-Arm i.p. and analyzed at the indicated time points p.i. Weight curves (A) and clinical scores (B) for infected mice are shown. (C) LCMV-np RNA levels in livers and CNS of WT, Irf9−/−, and Ifnar−/− mice. The LCMV-np RNA levels were normalized to Rpl32 mRNA levels. Data are means and standard errors of the means (SEM). (D) Histological changes in hematoxylin and eosin (H&E)-stained sections of WT, Irf9−/−, and Ifnar−/− mice. Arrows point to inflammatory infiltrates in livers and CNS of infected Irf9−/− and Ifnar−/− mice. Bars = 100 μm. For all panels, experiments were repeated three times with consistent results. Asterisks indicate comparisons of WT versus Irf9−/− mice, and number (#) symbols indicate comparison of WT versus Ifnar−/− mice. *, P < 0.05; **, P < 0.01; ***, P < 0.001. One-way analysis of variance (ANOVA) with Tukey's posttest was used for multiple comparisons.
FIG 2
FIG 2
IRF9 deficiency impairs accumulation of effector CD8+ T cells and induces exhaustion. (A to F) WT, Irf9−/−, and Ifnar−/− mice were infected with LCMV-Arm i.p., and the spleens were analyzed at day 8 p.i. (A) Frequencies of CD8+ T cells and LCMV GP33–41 and LCMV NP396–404 dextramer-positive (Dex+) CD8+ T cells in WT, Irf9−/−, and Ifnar−/− mice. Left panels depict GP33–41 Dex+ CD8+ T cells in naive (uninfected) mice. (B and C) Mean fluorescence intensities (MFI) for CD44 and KLRG1 of LCMV-GP33–41 Dex+ CD8+ T cells in WT, Irf9−/−, and Ifnar−/− mice. (D) Splenocytes were stimulated with GP33–41 peptide and analyzed for IFN-γ and TNF-α production by intracellular staining. n.c., nonstimulated control. The numbers display percentages of positive cells. (E and F) MFI for PD1 and LAG3 of LCMV-GP33–41 Dex+ CD8+ T cells in WT, Irf9−/−, and Ifnar−/− mice. For all panels, representative histograms are shown, and bar diagrams display means and SEM (n = 5 per group). Data from one of two independent experiments with consistent results are shown. **, P < 0.01; ***, P < 0.001; ****, P < 0.0001; n.s., not significant (unpaired two-tailed Student's t test).
FIG 3
FIG 3
IRF9 extrinsically regulates the accumulation of effector CD8+ T cells. (A to F) Prior to LCMV-Arm infection, 104 negatively sorted CD8+ T cells from CD45.1+ P14 mouse cells were transferred into WT or Irf9−/− mice (A, C, and E) or into WT or Ifnar−/− mice (B, D, and F). The spleens were analyzed at day 8 p.i. (A) Representative contour plots give CD45.1 and CD8α staining of transferred P14 cells in WT or Irf9−/− mice. The numbers show percentages of positive cells. The bar diagram to the right shows the number of P14 cells among total splenocytes. (B) Number of P14 cells among total splenocytes in WT or Ifnar−/− recipients. (C) MFI for KLRG1 of P14 cells transferred into WT or Irf9−/− mice. Representative histograms and bar diagrams are shown. (D) MFI for KLRG1 of P14 cells transferred into WT or Ifnar−/− recipients. (E) Splenocytes were stimulated with GP33–41 peptide and analyzed for intracellular IFN-γ and TNF-α production. The left panels display representative contour plots, in which the numbers indicate percentages of positive cells. The bar diagram to the right gives percentages of P14 cells, with the WT level set to 100%. (F) Percentage of IFN-γ+ TNF-α+ P14 cells transferred into WT or Ifnar−/− recipients. All bar diagrams show means and SEM (n = 5 mice per group). Data from one of two independent experiments with consistent results are shown. *, P < 0.05; **, P < 0.01; ***, P < 0.001 (unpaired two-tailed Student's t test).
FIG 4
FIG 4
IRF9 extrinsically regulates exhaustion of CD8+ T cells. Prior to LCMV-Arm infection, 104 negatively sorted CD8+ T cells from CD45.1+ P14 mouse cells were transferred into WT or Irf9−/− mice (A, C, E, and G) or into WT or Ifnar−/− mice (B, D, F, and H). Spleens were analyzed at day 8 p.i. (A to H) MFI for LAG3, PD1, Eomes, and T-bet of P14 cells transferred into WT, Irf9−/−, or Ifnar−/− mice. Representative histograms are shown. Bar diagrams display means and SEM (n = 5 per group). (I and J) Prior to LCMV-Arm infection, 104 negatively sorted CD8+ T cells from CD45.2+ P14 mice or from CD45.2+ Irf9−/− P14 mice were transferred into CD45.1+ WT mice. The spleens were analyzed at day 8 p.i., and the graphs show MFI for PD1 and LAG3 of WT or Irf9−/− P14 cells transferred into WT mice. Representative histograms are shown. Bar diagrams to the right display means and SEM (n = 5 per group). For panels A to F, data from one of two independent experiments with consistent results are shown. **, P < 0.01; ***, P < 0.001; n.s., not significant (unpaired two-tailed Student's t test).
FIG 5
FIG 5
IRF9 is important for DC function in response to IFN-I and TLR7 as well as TLR9 ligands. (A to D) WT or Irf9−/− Flt3L-DCs were left unstimulated (n.c.) or were stimulated with LPS, RNA40 complexed to DOTAP, CpG2216, or IFN-β. (Α) Cytokine concentrations were measured by ELISA after 22 h of stimulation. (B and D) mRNA levels for the indicated genes were analyzed by qRT-PCR analysis and normalized to the levels of Hprt1. Relative expression was calculated by setting the value for unstimulated WT Flt3L-DCs to 1. (C) Immunoblotting of IRF7, MAPK, p65, and β-actin in WT or Irf9−/− Flt3L-DCs after 22 h of stimulation with RNA40 or CpG2216 or in unstimulated cells (n.c.). For panel A, data were combined from three independent experiments performed in duplicate and are means and SEM. For panels B and D, data were combined from two independent experiments performed in duplicate and are means and SEM. For panel C, data from one of three independent experiments with consistent results are shown. **, P < 0.01; ***, P < 0.001; n.s., not significant (Student's t test).
FIG 6
FIG 6
IRF9 is essential for dendritic cell function and early restriction of LCMV-Arm dissemination. (A to H) WT, Irf9−/−, and Ifnar−/− mice were infected with LCMV-Arm and analyzed at the indicated time points p.i. (A) IFN-α and IFN-β levels in plasma at the indicated time points p.i. (n = 4 per group). (B and C) Enriched pDCs of WT, Irf9−/−, and Ifnar−/− mice at day 1 p.i. were used for RNA isolation and qRT-PCR analysis. The values were normalized to the levels of the 18S rRNA gene, and relative expression was calculated by setting the value for Ifnar−/− mice to 1. (D and E) Immunofluorescence of spleen sections from WT, Irf9−/−, and Ifnar−/− mice at day 3 p.i., stained for LCMV-NP, CD11c (DCs), and CD169 (metallophilic macrophages adjacent to the marginal zone of the spleen) (n = 3 per group). Original magnification, ×10. (F to H) Ex vivo flow analysis of SCA-1, CD80, and CD86 on pDCs (CD3e NK1.1 B220+ CD11c+), CD8+ cDCs (CD3e NK1.1 B220 CD11chi MHChi CD8a+), and CD11b+ cDCs (CD3e NK1.1 B220 CD11chi MHChi CD11b+) at day 4 p.i. *, P < 0.05; **, P < 0.01; ***, P < 0.001; ****, P < 0.0001; n.s., not significant (unpaired two-tailed Student's t test).

Similar articles

Cited by

References

    1. Kaech SM, Cui W. 2012. Transcriptional control of effector and memory CD8(+) T cell differentiation. Nat Rev Immunol 12:749–761. doi: 10.1038/nri3307. - DOI - PMC - PubMed
    1. Wherry EJ, Kurachi M. 2015. Molecular and cellular insights into T cell exhaustion. Nat Rev Immunol 15:486–499. doi: 10.1038/nri3862. - DOI - PMC - PubMed
    1. Crouse J, Kalinke U, Oxenius A. 2015. Regulation of antiviral T cell responses by type I interferons. Nat Rev Immunol 15:231–242. doi: 10.1038/nri3806. - DOI - PubMed
    1. Wherry EJ. 2011. T cell exhaustion. Nat Immunol 12:492–499. doi: 10.1038/ni.2035. - DOI - PubMed
    1. Speiser DE, Utzschneider DT, Oberle SG, Munz C, Romero P, Zehn D. 2014. T cell differentiation in chronic infection and cancer: functional adaptation or exhaustion? Nat Rev Immunol 14:768–774. doi: 10.1038/nri3740. - DOI - PubMed

Publication types

MeSH terms

Substances

LinkOut - more resources