. 2017 Sep 7;2(17):e94904.
doi: 10.1172/jci.insight.94904.

Wnt11 regulates cardiac chamber development and disease during perinatal maturation

Affiliations

Wnt11 regulates cardiac chamber development and disease during perinatal maturation

Marlin Touma et al. JCI Insight. .

Abstract

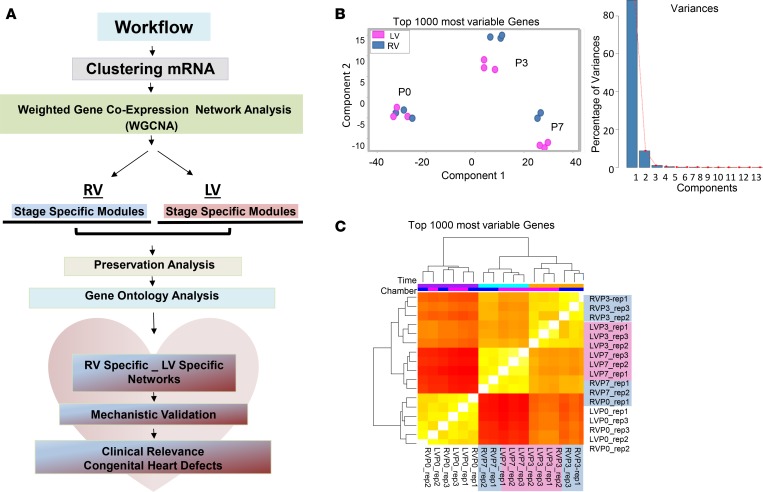
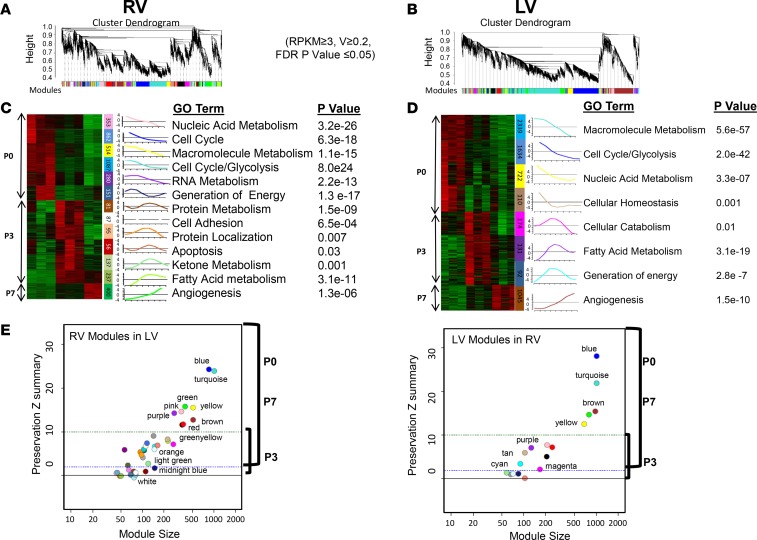
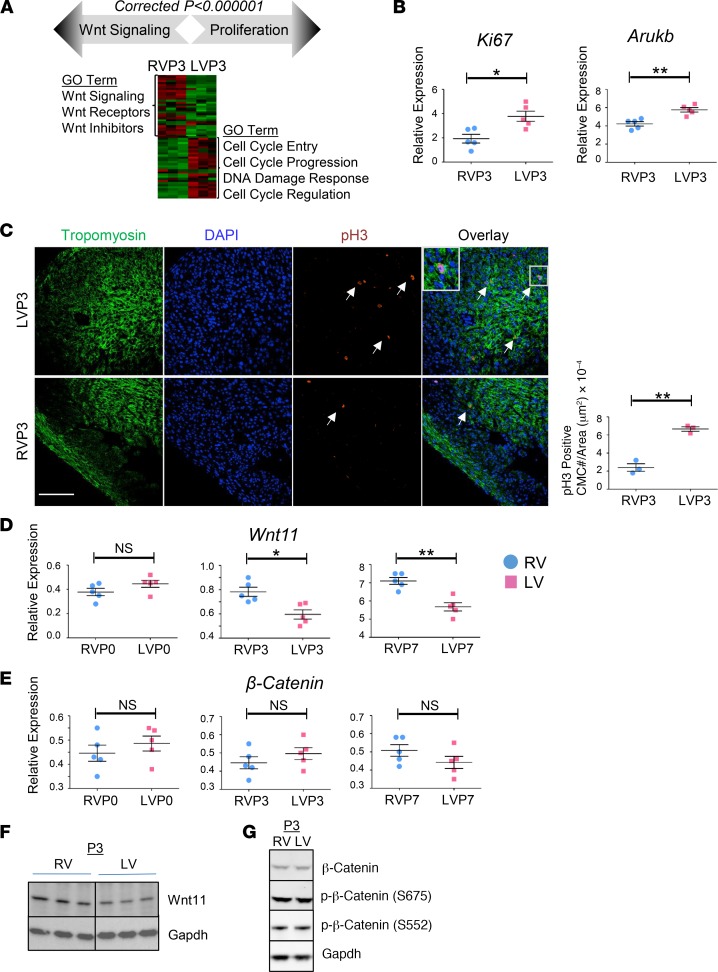
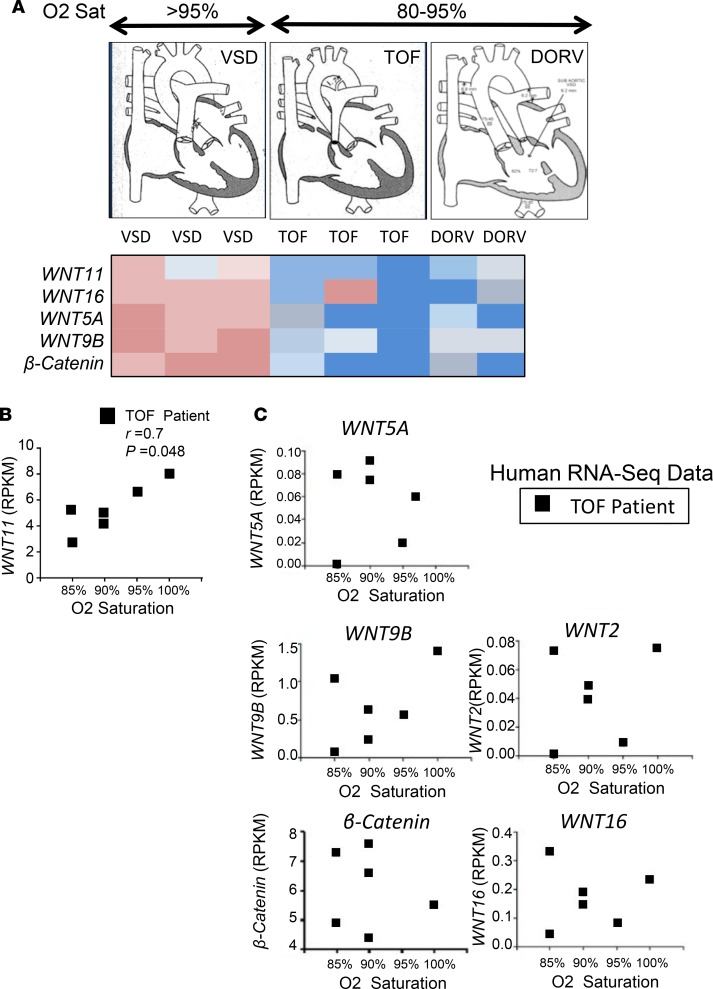
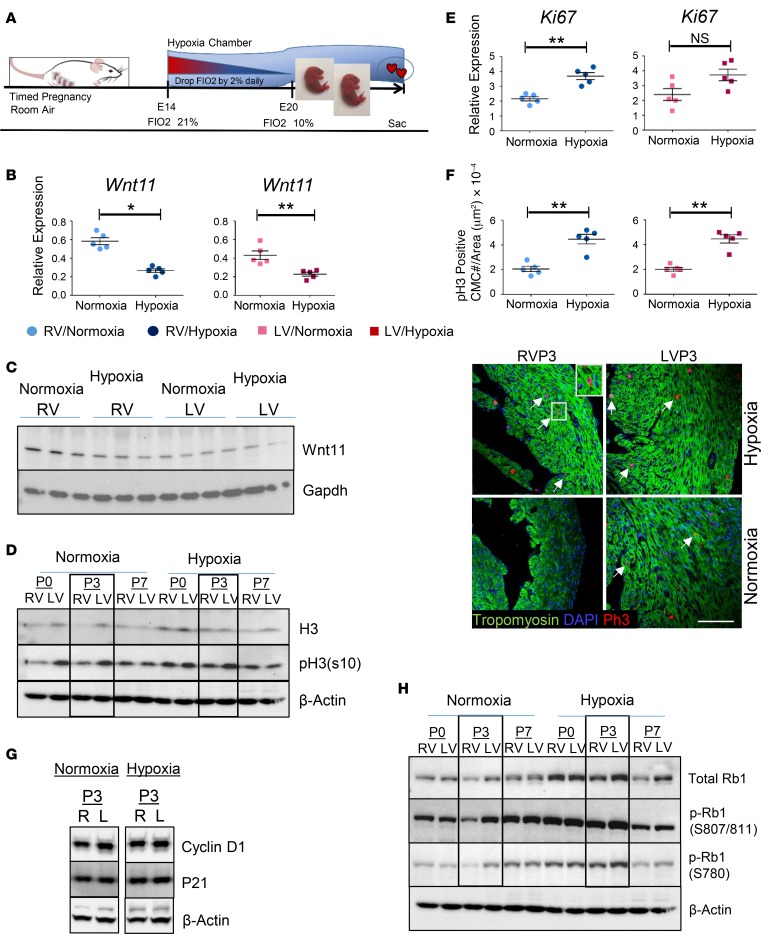
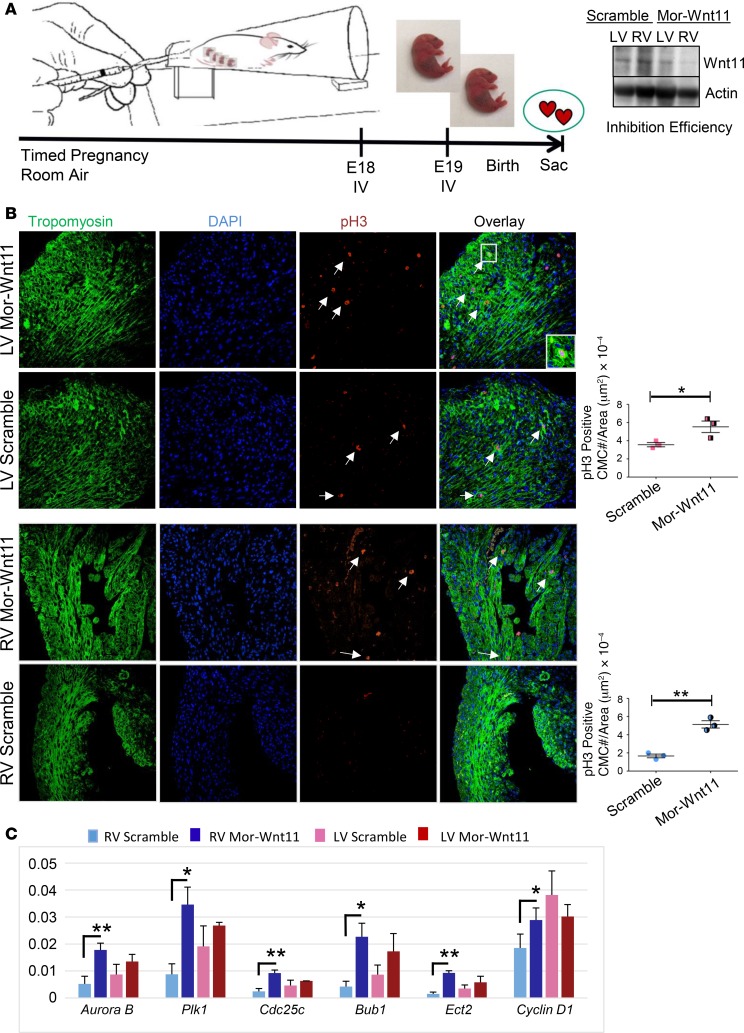
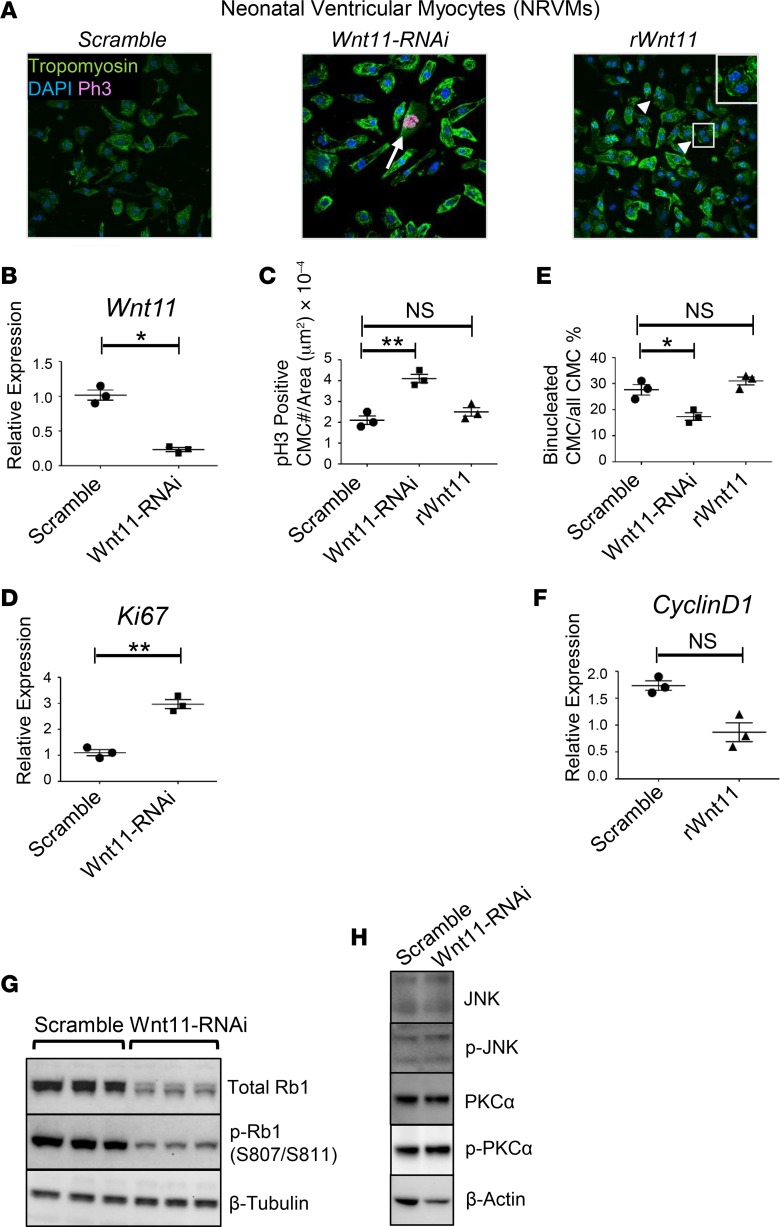
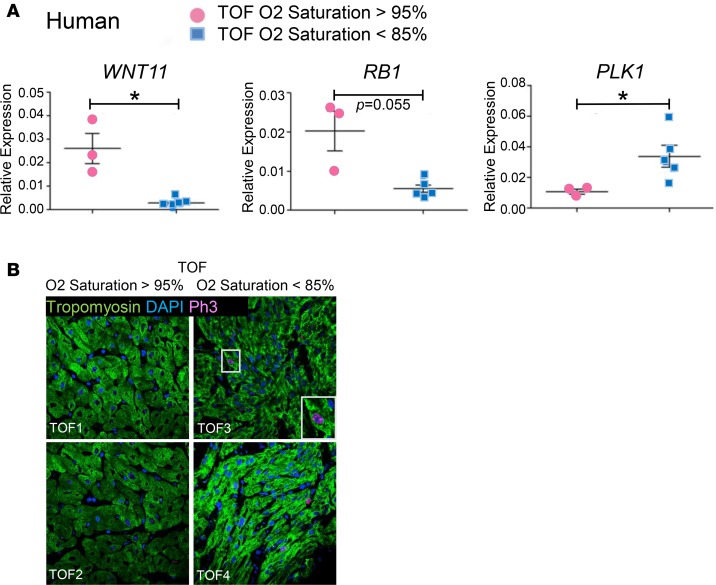
Ventricular chamber growth and development during perinatal circulatory transition is critical for functional adaptation of the heart. However, the chamber-specific programs of neonatal heart growth are poorly understood. We used integrated systems genomic and functional biology analyses of the perinatal chamber specific transcriptome and we identified Wnt11 as a prominent regulator of chamber-specific proliferation. Importantly, downregulation of Wnt11 expression was associated with cyanotic congenital heart defect (CHD) phenotypes and correlated with O2 saturation levels in hypoxemic infants with Tetralogy of Fallot (TOF). Perinatal hypoxia treatment in mice suppressed Wnt11 expression and induced myocyte proliferation more robustly in the right ventricle, modulating Rb1 protein activity. Wnt11 inactivation was sufficient to induce myocyte proliferation in perinatal mouse hearts and reduced Rb1 protein and phosphorylation in neonatal cardiomyocytes. Finally, downregulated Wnt11 in hypoxemic TOF infantile hearts was associated with Rb1 suppression and induction of proliferation markers. This study revealed a previously uncharacterized function of Wnt11-mediated signaling as an important player in programming the chamber-specific growth of the neonatal heart. This function influences the chamber-specific development and pathogenesis in response to hypoxia and cyanotic CHDs. Defining the underlying regulatory mechanism may yield chamber-specific therapies for infants born with CHDs.

Keywords: Cardiology; Cardiovascular disease; Cell cycle; Genetics; Molecular biology.


Conflict of interest statement

Conflict of interest: The authors have declared that no conflict of interest exists.

Figures

Figure 1
Figure 1. Transcriptome landscape in neonatal mouse heart chambers.
(A) Schematic representation of transcriptome analysis workflow. mRNA expression data were derived from deep RNA sequencing data sets of male C57B/6 mouse left ventricles (LVs) and right ventricles (RVs) at postnatal day 0 (P0; before the ductal closure), day 3 (P3; transition), and day 7 (P7; terminal differentiation of the vast majority of CMCs). n = 3 replicates per chamber per time point, except RVP7 (n = 2 replicates). Weighted gene network coexpression analysis (WGCNA) was performed to construct gene coexpression modules in RVs and LVs separately, followed by module preservation analysis and gene ontology analysis to identify chamber-specific genes/gene networks. (B) Principal component analysis (PCA) result of the top 1,000 varied genes (left) and the percentage of variation that corresponds to each component (right). PCA was conducted using R function prcomp. Top 1,000 varied mRNAs based on Tophat alignment results were used to generate PCAs. (C) Unsupervised hierarchical clustering of top 1,000 varied genes derived from 17 RNA-Seq data sets (n = 3 replicates per chamber per time point, except RVP7 [n = 2 replicates]). Experimental conditions of the samples are demarcated by color bars at the top according to chamber: RV (blue) and LV (pink), and time point: P0 (purple), P3 (orange), and P7 (turquoise). Samples from P3 and P7 clustered closely together away from P0, suggesting sharp transcriptome changes during the P0–P3 window. Transcripts from LVs and RVs formed distinct clusters after birth (at P3 and P7), suggesting a temporal chamber-specific transcriptome signature in postnatal heart.
Figure 2
Figure 2. Weighted gene network coexpression analysis (WGCNA) reveals stage-specific modules (gene network) in neonatal left and right ventricles.
(A and B) WGCNA dendrograms of right ventricle (RV) (A) and left ventricle (LV) (B) mRNA transcriptome. Genes with mean reads per kilobase of transcript per million mapped reads (RPKM) greater than or equal to 3 in at least one sample (3 replicates) of each category and variation greater than or equal to 0.2 across samples (FDR P value ≤ 0.05) were included from RV and LV data sets separately. Genes are clustered based on the topological overlap, a measure of connection strength. Using the R package, gene modules were constructed as groups of genes with highly similar coexpression relationships. Branches in the hierarchical clustering dendrograms correspond to modules. Color bars below the dendrograms display gene coexpression modules identified by WGCNA in RVs (A) or in LVs (B). The y axes (height) represent module significance (correlation with external trait). (C and D) Heatmaps depict expression profiles of stage-specific mRNA modules’ member genes. Thirteen stage-specific modules in RVs (C) and 8 stage-specific modules in LVs (D) are presented with upregulated genes in red, and downregulated genes in green. The expression profiles are standardized; changes are expressed in log2 scale. The numbers of genes corresponding to each module are shown in color bars. Unique stage-specific modules in LVs and RVs are defined as those with Pearson’s correlation coefficient r greater than or equal to 0.7 and P value less than or equal to 0.05 between the module eigengene (expression profile summary) and the maturation stage (P0, P3, or P7). Eigengene of a given module is presented (bar graphs). Top gene ontology (GO) term enriched in each module along with corresponding adjusted P value is listed to the right of each module. The color code is preserved. (E) Preservation plots of RV modules in LVs, and LV modules in RVs. Module size (x axis) and preservation Z-summary scores (y axis) are shown. Z summary less than 2 indicates modules were weakly or not preserved, Z summary between 2 and 10 indicates modules were moderately preserved, and Z summary greater than 10 indicates modules were well or strongly preserved. Color codes of the modules are preserved.
Figure 3
Figure 3. Chamber-specific enrichment of cellular proliferation and Wnt signaling revealed by neonatal heart transcriptome analysis.
(A) Gene ontology (GO) analysis depicting chamber-specific enrichment of Wnt signaling and cell cycle processes in P3 poorly preserved modules. Expression heatmap of cell proliferation/cell cycle genes (enriched in left ventricular [LV] modules) and Wnt signaling genes (enriched in right ventricular [RV] modules) in P3 neonatal heart is shown. Expression changes are expressed in log2 scale. Red, upregulated; green, downregulated. (B) qRT-PCR analysis of proliferation marker Ki67 and mitosis marker aurora kinase B (AurkB) in LV or RV myocardium of WT neonatal mouse (n = 5) at P3. Blue, RV; pink, LV. Error bars represent SEM. (C) Representative confocal images of anti–phospho-histone H3 (anti–p-H3) immunohistochemistry (IHC) in RVs or LVs of WT neonatal mouse heart at P3. Arrows indicate p-H3–positive cardiomyocytes (CMCs). Original magnification, ×40. (D and E) qRT-PCR analysis of Wnt11 and β-catenin in LV or RV myocardium of WT neonatal mouse, P0 through P7 (n = 5). Blue, RV; pink, LV. Error bars represent SEM. (BE) by unpaired, 2-tailed Student’s t test. Data are representative of 3 independent experiments. (F) Wnt11 protein expression in LV and RV myocardium of WT neonatal mouse hearts at P3 (Western blot). Gapdh was used as loading control. n = 3 replicates per condition. See related Supplemental Figure 3. (G) Expression of β-catenin protein and its phosphorylated forms at Ser675 and Ser552 (S675 and S552) in LV and RV myocardium of WT neonatal mouse hearts at P3 (Western blot). Gapdh was used as loading control. n = 3 replicates per condition. NS, not significant. *P ≤ 0.05, **P ≤ 0.01.
Figure 4
Figure 4. Wnt11 may play important roles in human congenital heart defects (CHDs).
(A) Expression array of Wnt molecules and cell cycle genes in cyanotic (hypoxemic) versus noncyanotic (nonhypoxemic) human CHD phenotypes. Graphs: Representative illustrations of CHD cases. VSD, ventricular septal defect (n = 3); TOF, Tetralogy of Fallot (n = 3); DORV, double-outlet right ventricle (n = 2). Red, upregulated; blue, downregulated. (B) Correlation plot demonstrating Wnt11 association with preoperative O2 saturation levels in heart tissue specimens from TOF patients with different baseline O2 saturation levels (n = 6). r, Pearson’s correlation coefficient; P, correlation P value. Wnt11 expression data were obtained from M. Touma’s unpublished observations (RNA-Seq data set) of human heart tissue of patients with TOF. RPKM, reads per kilobase of transcript per million mapped reads. (C) Correlation plots revealed no association between the expression of several WNT genes (WNT5A, WNT9B, WNT2, WNT16, and β-catenin) and preoperative O2 saturation levels in a new set of TOF patients (n = 6) with different baseline O2 saturation levels. The expression data (RPKM) were obtained from RNA-Seq of heart tissue of patients with TOF (M. Touma’s unpublished observations [RNA-Seq data set]).
Figure 5
Figure 5. Hypoxia regulates neonatal cardiomyocyte proliferation in a chamber-specific manner.
(A) Schematic illustration of experimental design for perinatal systemic hypoxia exposure. Neonatal pups were reared with their dams in either normoxia or hypoxia (10% FIO2) and maintained until the predecided end points (P0, P3, or P7). The dams carrying the experimental group (hypoxia) were acclimatized in the hypoxia chamber by decreasing FIO2 by 2% daily for at least 5 days preceding the experiment starting at E14.5 to reach 10% on E19.5. (B) Wnt11 mRNA expression in left ventricular (LV) and right ventricular (RV) myocardium of WT neonatal mouse at P3 in normoxic and hypoxic conditions (qRT-PCR). n = 5 replicates per condition. (C) Wnt11 protein expression in LV and RV myocardium of WT neonatal mouse at P3 in normoxic and hypoxic conditions (Western blot). Gapdh was used as loading control, n = 3 replicates per condition. See related Supplemental Figure 3. (D) Expression time course of histone H3 protein and p-H3 at Ser10 (S10), P0 through P7, in LV or RV myocardium of WT neonatal mouse hearts in normoxic or hypoxic condition (left panel). n = 5 replicates per condition. (E) Expression of proliferation marker Ki67 for LV or RV myocardium of WT neonatal mouse hearts in normoxic or hypoxic conditions (qRT-PCR). n = 5 replicates per condition. (F) Representative confocal images of anti–phospho-histone H3 (anti–p-H3) immunohistochemistry (IHC) in LVs and RVs of WT neonatal mouse heart at P3 in normoxic and hypoxic conditions. Arrows: representative p-H3–positive cardiomyocytes. Original magnification ×60. Graph: quantitative analysis of p-H3–positive cells (cell number/area [μm2], n = 5 replicates per condition. (G) Expression of cyclin D1 and P21 proteins in LV or RV myocardium of P3 WT neonatal mouse hearts in normoxic or hypoxic condition. β-Actin was used as loading control. n = 5 replicates per condition. (H) Expression time course of Rb1 protein and phosphorylated Rb1 (p-Rb1) at Ser807/811 and Ser780 (S807/811 and S780), P0 through P7, in LV or RV myocardium of WT neonatal mouse hearts in normoxic or hypoxic condition (n = 5 replicates per condition). Error bars represent SEM. *P ≤ 0.05, **P ≤ 0.01 by unpaired, 2-tailed Student’s t test.
Figure 6
Figure 6. Systemic Wnt11 inhibition induces cardiomyocyte proliferation in a chamber-specific manner.
(A) Schematic illustration of experimental design for in vivo Wnt11 knockdown. Analysis of inhibition efficiency (Western) is shown (right panel). Mor-Wnt11 (Vivo-Morpholino-Wnt11): Wnt11-specific modified antisense oligonucleotide. (B) Representative confocal images of anti–phospho-histone H3 (anti–p-H3) immunohistochemistry (IHC) in scramble control or Mor-Wnt11–injected neonatal mouse hearts at P3. Arrows indicate representative p-H3–positive cardiomyocytes (CMCs). Original magnification, ×40. Graphs: Quantitative analysis of p-H3–positive cells (cell number/area [μm2]. (C) Expression analysis of several proliferation and mitosis markers using mRNA from LV or RV myocardium of Mor-Wnt11– or scramble-treated neonatal mouse (qRT-PCR). n = 3 per condition. Data are representative of 2 independent experiments. Error bars represent SEM. *P ≤ 0.05, **P ≤ 0.01 by unpaired, 2-tailed Student’s t test (Mor-Wnt11 compared with control).
Figure 7
Figure 7. Wnt11 regulates neonatal ventricular myocyte proliferation.
(A) Manipulation of Wnt11 in neonatal rat ventricular myocytes (NRVMs). Immunohistochemical (IHC) analysis of control (untreated), Wnt11-RNAi–treated, and exogenous recombinant Wnt11 (rWnt11)–treated NRVMs illustrates elongated mononucleated and phospho-histone H3–positive (p-H3–positive) cardiomyocytes (arrow) in Wnt11-suppressed NRVMs, and triangle-shaped, binucleated cardiomyocytes (arrow heads) in exogenous rWnt11-treated NRVMs. Original magnification, ×60. (B) Wnt11 inhibition efficiency analysis (qRT-PCR) is shown (right). (C) p-H3–positive cell number/area (μm2) in scramble-treated, Wnt11 siRNA–treated, or rWnt11-treated NRVMs. (D) Expression analysis of proliferation marker (Ki67) using RNA from scramble-treated or Wnt11 siRNA–treated NRVMs (qRT-PCR). (E) Binucleation index (binucleated cardiomyocyte number × 100/total cardiomyocytes/area [μm2]) analysis of scramble-treated, Wnt11 siRNA–treated, or rWnt11-treated NRVMs. n = 3 replicates per condition. Data are representative of 3 independent experiments. (F) Expression of proliferation marker (cyclin D1) using RNA from scramble-treated or rWnt11-treated NRVMs (qRT-PCR). (G) Western analysis of Rb1 protein abundance and phosphorylation (S807/S811) in neonatal myocytes in response to Wnt11 inhibition suggests that Wnt11 loss is associated with Rb1 suppression and reduced p-Rb1. (H) Western analysis of JNK and PKCα protein expression and their phosphorylated forms p-JNK and p-PKCα in NRVMs in response to Wnt11 suppression. *P ≤ 0.05; **P ≤ 0.01 by 1-way ANOVA and post-hoc Kruskal-Wallis test (C and E) and 2-tailed Student’s t test (B, D, and F) were used for intergroup analyses. NS, not significant.
Figure 8
Figure 8. Wnt11 loss in hypoxemic TOF infants is associated with Rb1 suppression and induction of Plk1.
(A) Expression of Wnt11, Rb1, and Plk1 in TOF patients (qRT-PCR), n = 5 TOF cases were hypoxemic (O2 saturation < 85%), and n = 3 cases with normal O2 saturation (>95%). (B) Representative confocal images of anti–phospho-histone H3 (anti–p-H3) immunohistochemistry (IHC) in TOF infants. Arrows indicate representative p-H3–positive cardiomyocytes. Original magnification, ×60. Note: The studies presented in this figure were performed in a new group of TOF patients that were not included in the studies presented in Figure 4. Error bars represent SEM. *P ≤ 0.05 by unpaired, 2-tailed Student’s t test.

References

    1. Touma M, et al. Decoding the long noncoding RNA during cardiac maturation: a roadmap for functional discovery. Circ Cardiovasc Genet. 2016;9(5):395–407. doi: 10.1161/CIRCGENETICS.115.001363. - DOI - PMC - PubMed
    1. Finnemore A, Groves A. Physiology of the fetal and transitional circulation. Semin Fetal Neonatal Med. 2015;20(4):210–216. doi: 10.1016/j.siny.2015.04.003. - DOI - PubMed
    1. Sinha SK, Donn SM. Fetal-to-neonatal maladaptation. Semin Fetal Neonatal Med. 2006;11(3):166–173. doi: 10.1016/j.siny.2006.01.008. - DOI - PubMed
    1. Rudolph AM. Myocardial growth before and after birth: clinical implications. Acta Paediatr. 2000;89(2):129–133. doi: 10.1080/080352500750028681. - DOI - PubMed
    1. Smolich JJ, Walker AM, Campbell GR, Adamson TM. Left and right ventricular myocardial morphometry in fetal, neonatal, and adult sheep. Am J Physiol. 1989;257(1 Pt 2):H1–H9. - PubMed

Publication types

MeSH terms