. 2017 Sep 7;2(17):e94379.
doi: 10.1172/jci.insight.94379.

Correction of intermittent hypoxia reduces inflammation in obese subjects with obstructive sleep apnea

Affiliations

Correction of intermittent hypoxia reduces inflammation in obese subjects with obstructive sleep apnea

Sebastio Perrini et al. JCI Insight. .

Abstract

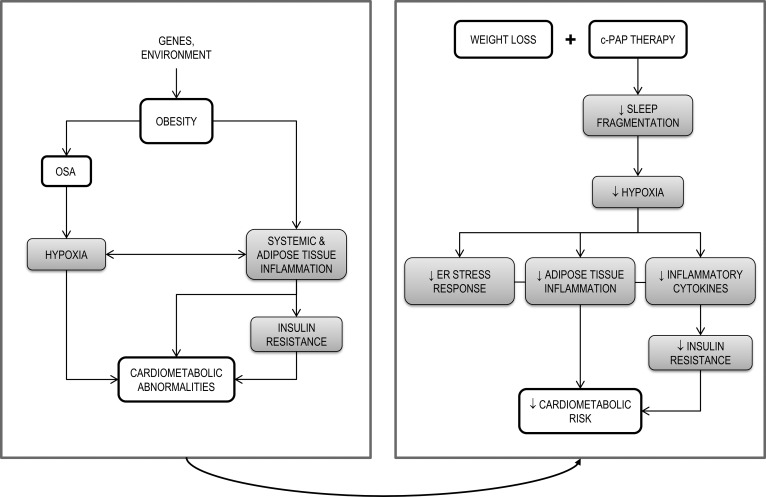
Background: In obese subjects with obstructive sleep apnea (OSA), chronic intermittent hypoxia (CIH) may be linked to systemic and adipose tissue inflammation.

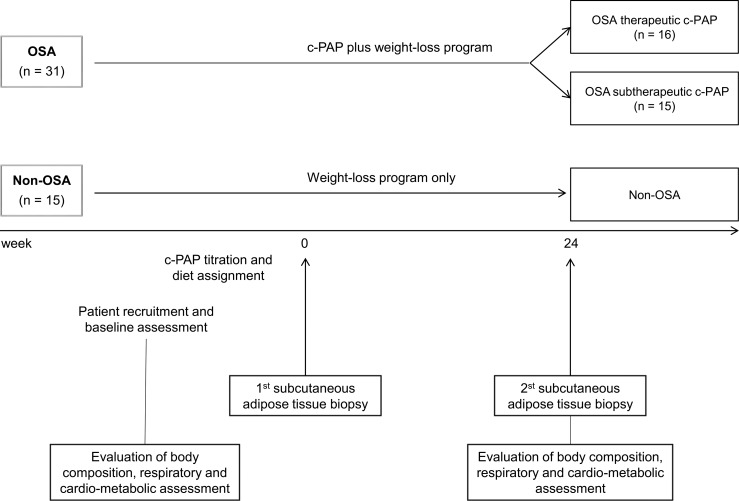
Methods: We obtained abdominal subcutaneous adipose tissue biopsies from OSA and non-OSA obese (BMI > 35) subjects at baseline and after 24 weeks (T1) of weight-loss intervention plus continuous positive airway pressure (c-PAP) or weight-loss intervention alone, respectively. OSA subjects were grouped according to good (therapeutic) or poor (subtherapeutic) adherence to c-PAP.

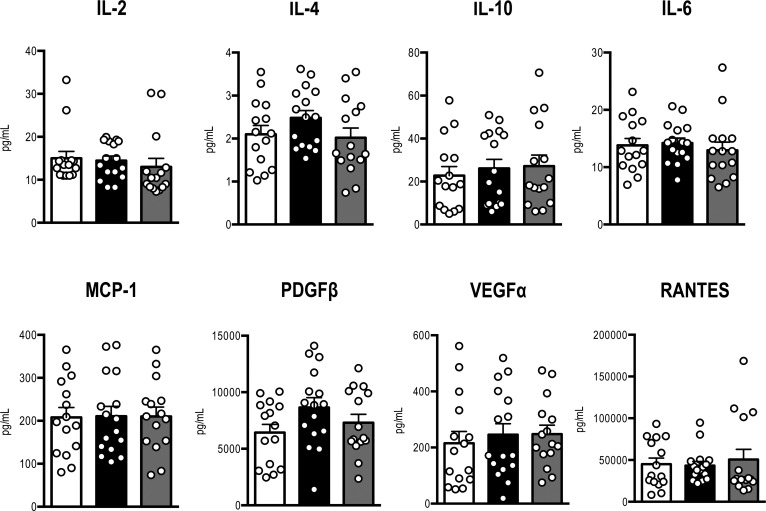
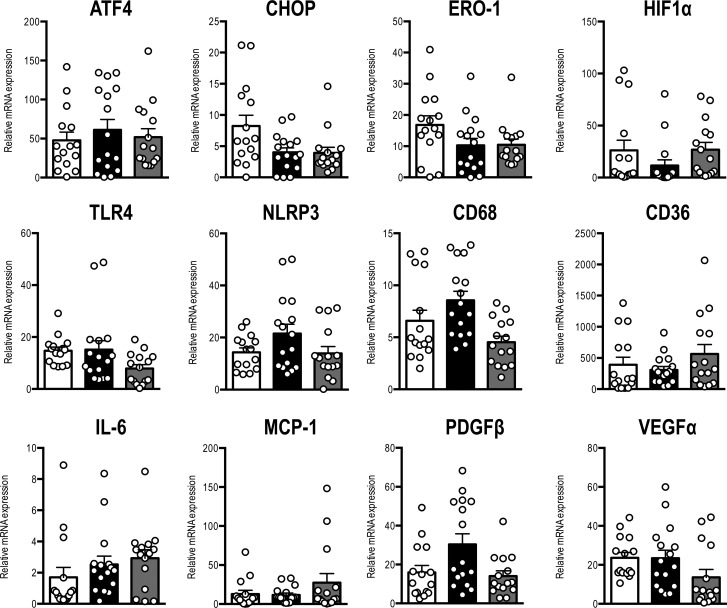
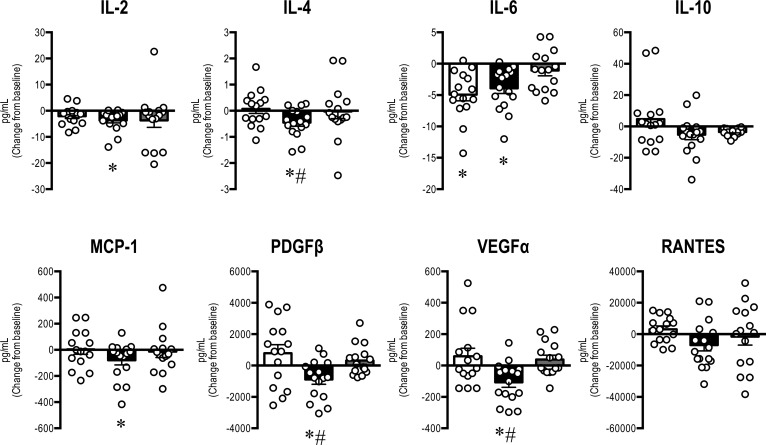
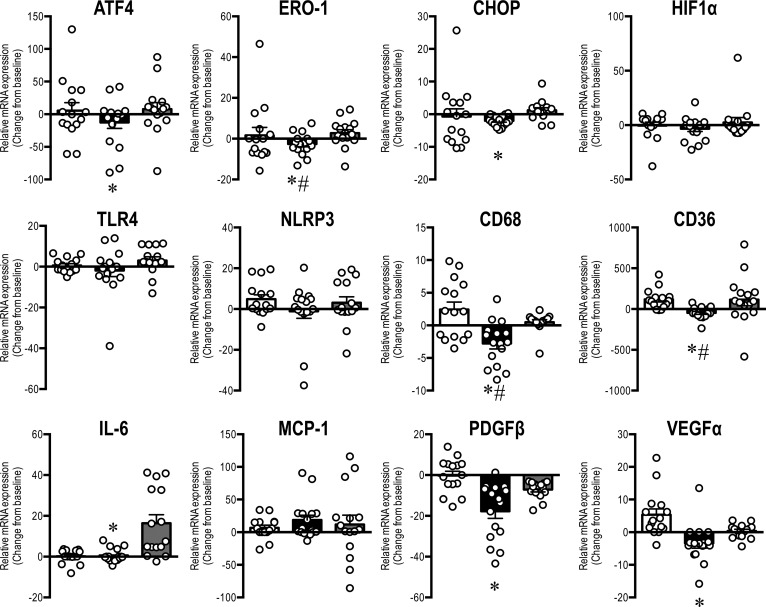
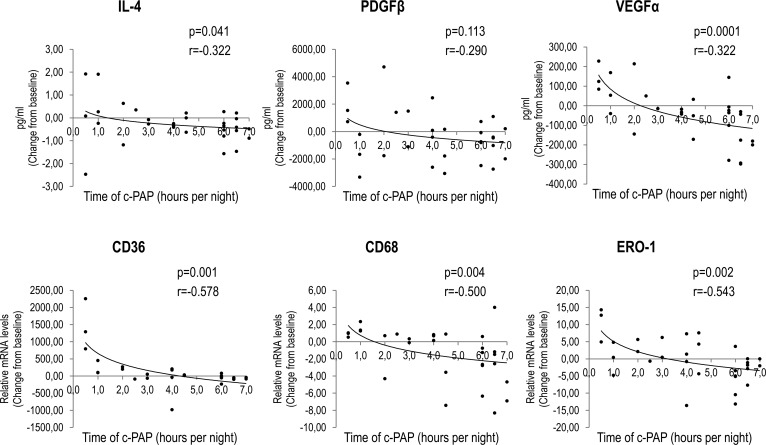
Results: At baseline, anthropometric and metabolic parameters, serum cytokines, and adipose tissue mRNA levels of obesity-associated chemokines and inflammatory markers were not different in OSA and non-OSA subjects. At T1, body weight was significantly reduced in all groups. Serum concentrations of IL-2, IL-4, IL-6, MCP-1, PDGFβ, and VEGFα were reduced by therapeutic c-PAP in OSA subjects and remained unaltered in non-OSA and subtherapeutic c-PAP groups. Similarly, adipose tissue mRNA levels of macrophage-specific (CD68, CD36) and ER stress (ATF4, CHOP, ERO-1) gene markers, as well as of IL-6, PDGFβ, and VEGFα, were decreased only in the therapeutic c-PAP group.

Conclusion: CIH does not represent an additional factor increasing systemic and adipose tissue inflammation in morbid obesity. However, in subjects with OSA, an effective c-PAP therapy improves systemic and obesity-associated inflammatory markers.

Funding: Ministero dell'Università e della Ricerca and Progetti di Rilevante Interesse Nazionale.

Keywords: Adipose tissue; Cytokines; Metabolism; Pulmonology; hypoxia.


Conflict of interest statement

Conflict of interest: The authors have declared that no conflict of interest exists.

Figures

Figure 1
Figure 1. Study design.
OSA, obstructive sleep apnea; c-PAP, continuous positive airway pressure.
Figure 2
Figure 2. Baseline serum cytokine concentrations in non-OSA, OSA therapeutic c-PAP, and OSA subtherapeutic c-PAP obese subjects.
Circulating levels were assessed in non-OSA (white bars), OSA therapeutic c-PAP (black bars), and OSA subtherapeutic c-PAP (gray bars) obese subjects at baseline. Serum levels (pg/ml) were determined by the Bio-Plex assay, as described in the Methods. Results are mean ± SEM (n = 2 measurements for each subject; n = 15 non-OSA, n = 16 OSA therapeutic c-PAP; and n = 15 OSA subtherapeutic c-PAP). Differences among groups were assessed with 1-way ANOVA statistical analysis. OSA, obstructive sleep apnea; c-PAP, continuous positive airway pressure.
Figure 3
Figure 3. Baseline mRNA expression of ER stress and inflammatory genes in subcutaneous adipose tissue from non-OSA, OSA therapeutic c-PAP, and OSA subtherapeutic c-PAP obese subjects.
Subcutaneous adipose tissue biopsies were obtained from non-OSA (white bars), OSA therapeutic c-PAP (black bars), and OSA subtherapeutic c-PAP (gray bars) obese subjects at baseline. mRNA levels of ER stress and inflammatory genes were determined by quantitative RT-PCR and normalized to 18S rRNA. Results are mean ± SEM of values in adipose tissue (n = 2 measurements for each subject; n = 15 non-OSA; n = 16 OSA therapeutic c-PAP; and n = 15 OSA subtherapeutic c-PAP). Differences among groups were assessed with 1-way ANOVA statistical analysis. ER, endoplasmic reticulum; OSA, obstructive sleep apnea; c-PAP, continuous positive airway pressure.
Figure 4
Figure 4. Effects of intervention on circulating cytokines.
Serum levels of IL-2, IL-4, IL-6, IL-10, MCP-1, PDGFβ, VEGFα, and RANTES were assessed in non-OSA (white bars), OSA therapeutic c-PAP (black bars), and OSA subtherapeutic c-PAP (gray bars) subjects before and after 24 weeks of treatment, as indicated in Figure 1. Absolute serum levels (pg/ml) were determined by Bio-Plex assay, as described in the Methods. Results shown are mean ± SEM of changes versus baseline (n = 2 measurements for each subject; n = 15 non-OSA; n = 16 OSA therapeutic c-PAP; and n = 15 OSA subtherapeutic c-PAP). *P < 0.05 vs. baseline (1-sample t test); #P < 0.05 vs. non-OSA and OSA subtherapeutic c-PAP (1-way ANOVA). OSA, obstructive sleep apnea; c-PAP, continuous positive airway pressure.
Figure 5
Figure 5. Effects of intervention on mRNA expression of ER stress and inflammatory genes in subcutaneous adipose tissue.
Subcutaneous adipose tissue biopsies were obtained in non-OSA (white bars), OSA therapeutic c-PAP (black bars), and OSA subtherapeutic c-PAP (gray bars) subjects before and after 24 weeks of treatment, as indicated in Figure 1. mRNA levels of ER stress and inflammatory genes were determined by quantitative RT-PCR and normalized to 18S rRNA. Results are mean ± SEM of changes versus baseline (n = 2 measurements for each subject; n = 15 non-OSA; n = 16 OSA therapeutic c-PAP; and n = 15 OSA subtherapeutic c-PAP). *P < 0.05 vs. baseline (1-sample t test). #P < 0.05 vs. non-OSA and OSA subtherapeutic c-PAP (1-way ANOVA). ER, endoplasmic reticulum; OSA, obstructive sleep apnea; c-PAP, continuous positive airway pressure.
Figure 6
Figure 6. Relationship between time of c-PAP use and systemic and adipose tissue inflammation.
Correlation between time of c-PAP use and serum levels of IL-4, PDGFβ, and VEGFα in OSA obese subjects (top). Correlation between time of c-PAP use and adipose tissue mRNA levels of CD36, CD68, and ERO1 in OSA obese subjects (bottom) (n = 16 OSA therapeutic c-PAP subjects; n = 15 OSA subtherapeutic c-PAP subjects). Statistical analysis was performed using Pearson correlation. OSA, obstructive sleep apnea; c-PAP, continuous positive airway pressure.
Figure 7
Figure 7. Proposed model of the effects of obesity, OSA, and c-PAP therapy on systemic and adipose tissue inflammation and cardiometabolic abnormalities.
OSA, obstructive sleep apnea; c-PAP, continuous positive airway pressure.

References

    1. Hotamisligil GS. Inflammation and metabolic disorders. Nature. 2006;444(7121):860–867. doi: 10.1038/nature05485. - DOI - PubMed
    1. Dewan NA, Nieto FJ, Somers VK. Intermittent hypoxemia and OSA: implications for comorbidities. Chest. 2015;147(1):266–274. doi: 10.1378/chest.14-0500. - DOI - PMC - PubMed
    1. Garvey JF, Pengo MF, Drakatos P, Kent BD. Epidemiological aspects of obstructive sleep apnea. J Thorac Dis. 2015;7(5):920–929. - PMC - PubMed
    1. Drager LF, Li J, Reinke C, Bevans-Fonti S, Jun JC, Polotsky VY. Intermittent hypoxia exacerbates metabolic effects of diet-induced obesity. Obesity (Silver Spring) 2011;19(11):2167–2174. doi: 10.1038/oby.2011.240. - DOI - PMC - PubMed
    1. Yadav R, et al. Impairment of high-density lipoprotein resistance to lipid peroxidation and adipose tissue inflammation in obesity complicated by obstructive sleep apnea. J Clin Endocrinol Metab. 2014;99(9):3390–3398. doi: 10.1210/jc.2013-3939. - DOI - PubMed

Publication types

MeSH terms