. 2017 Sep 7;2(17):e95703.
doi: 10.1172/jci.insight.95703.

Exome-capture RNA sequencing of decade-old breast cancers and matched decalcified bone metastases

Affiliations

Exome-capture RNA sequencing of decade-old breast cancers and matched decalcified bone metastases

Nolan Priedigkeit et al. JCI Insight. .

Abstract

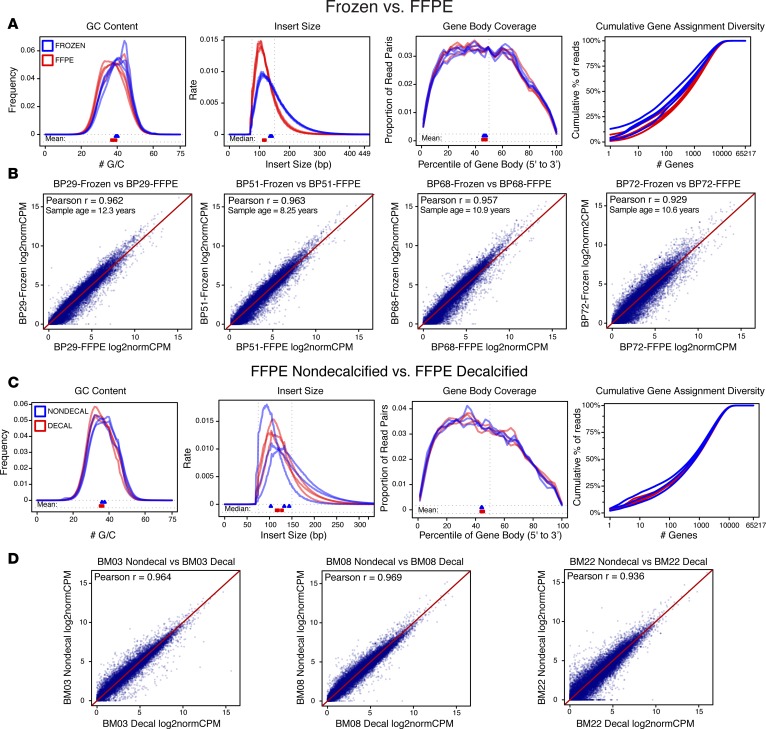
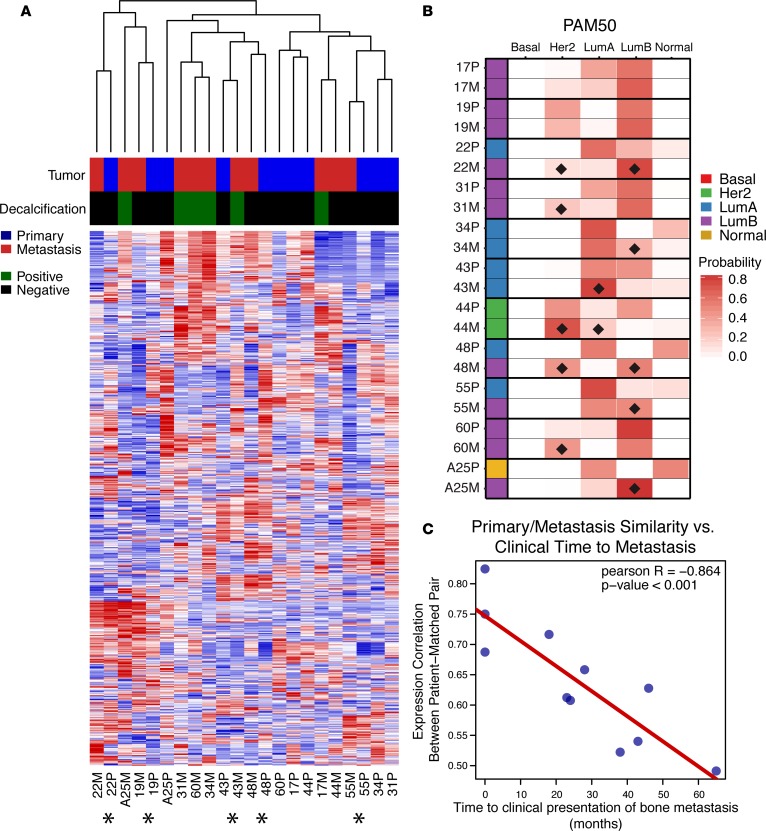
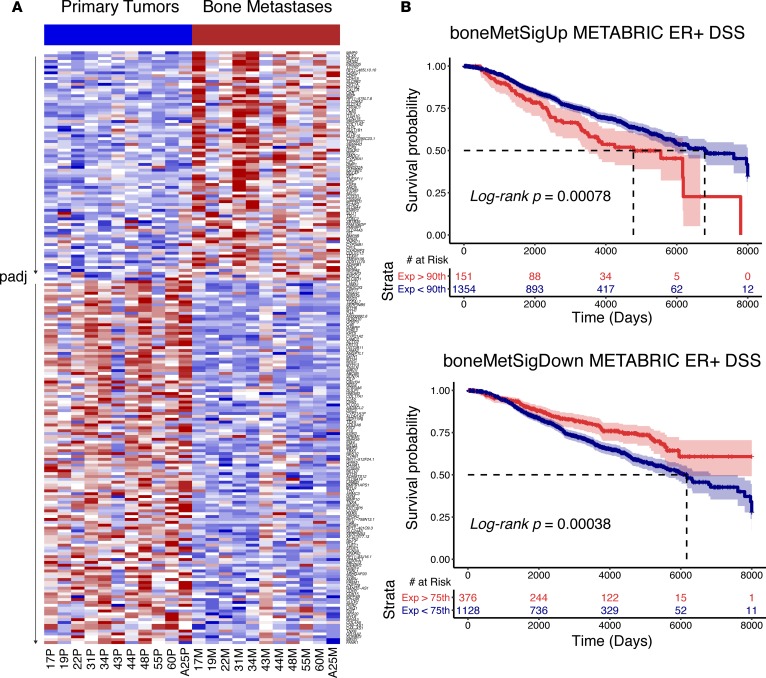
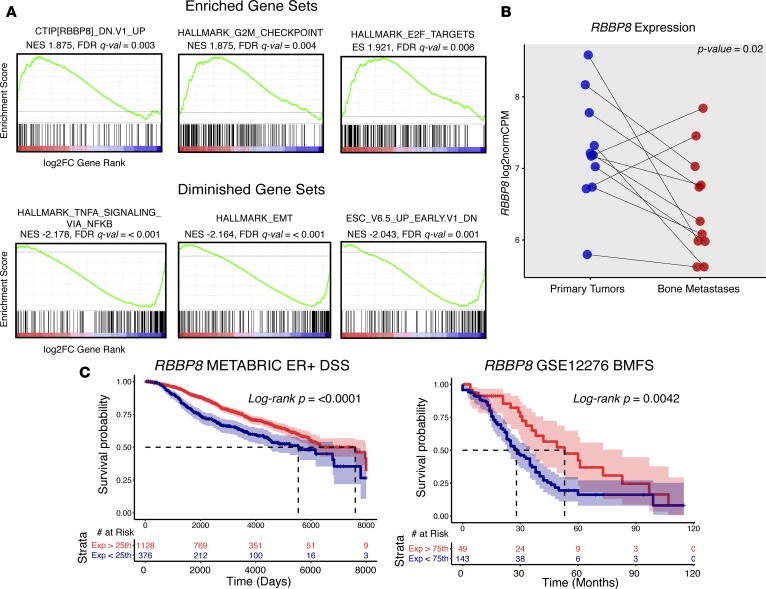
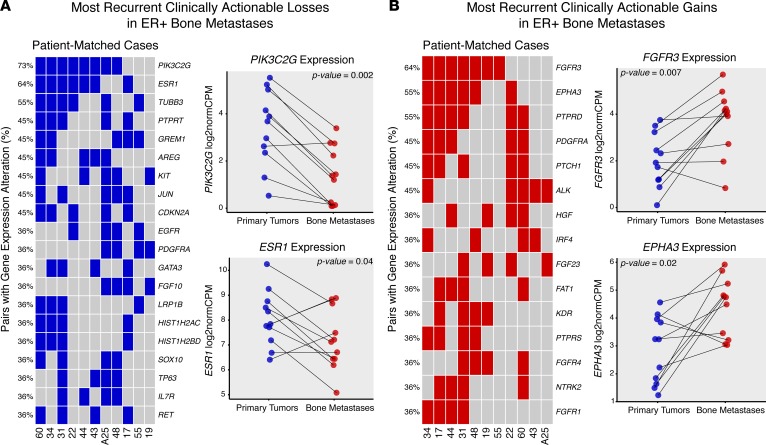
Bone metastases (BoM) are a significant cause of morbidity in patients with estrogen receptor-positive (ER-positive) breast cancer; yet, characterizations of human specimens are limited. In this study, exome-capture RNA sequencing (ecRNA-seq) on aged (8-12 years), formalin-fixed, paraffin-embedded (FFPE), and decalcified cancer specimens was evaluated. Gene expression values and ecRNA-seq quality metrics from FFPE or decalcified tumor RNA showed minimal differences when compared with matched flash-frozen or nondecalcified tumors. ecRNA-seq was then applied on a longitudinal collection of 11 primary breast cancers and patient-matched synchronous or recurrent BoMs. Overtime, BoMs exhibited gene expression shifts to more Her2 and LumB PAM50 subtype profiles, temporally influenced expression evolution, recurrently dysregulated prognostic gene sets, and longitudinal expression alterations of clinically actionable genes, particularly in the CDK/Rb/E2F and FGFR signaling pathways. Taken together, this study demonstrates the use of ecRNA-seq on decade-old and decalcified specimens and defines recurrent longitudinal transcriptional remodeling events in estrogen-deprived breast cancers.

Keywords: Breast cancer; Genetics; Oncology.


Conflict of interest statement

Conflict of interest: The authors have declared that no conflict of interest exists.

Figures

Figure 1
Figure 1. Exome-capture RNA sequencing of aged, FFPE, and decalcified tumors.
(A) ecRNA-seq quality metrics (GC content, insert size, gene body coverage, and cumulative gene assignment diversity) of aged and tumor-matched, formalin-fixed, paraffin-embedded (FFPE) and flash-frozen (FF) samples. FF samples in blue, FFPE samples in red (n = 4 pairs). (B) Expression value correlations between four sets of matched tumor samples (FF vs. FFPE), along with Pearson r correlations and sample ages. (C) ecRNA-seq quality metrics of matched nondecalcified and decalcified samples. Nondecalcified samples in blue, decalcified samples in red (n = 3 pairs). (D) Expression correlations between three sets of matched tumor samples (nondecalified vs. decalcified), along with Pearson r correlations.
Figure 2
Figure 2. Unsupervised clustering, intrinsic subtype shifts, and temporal evolution of ER-positive bone metastases.
(A) Unsupervised hierarchical clustering heatmap (red, high relative expression; blue, low relative expression) of patient-matched pairs (n = 11) using the top 5% most variable genes (n = 1,096) across the cohort. Tumor (primary in blue, metastasis in red) and decalcification status (positive in green, negative in black) are indicated. Asterisks below heatmap designate patient-matched pairs that cluster in a single doublet clade. (B) Discrete PAM50 assignments (red, basal; green, HER2; blue, LumA; purple, LumB; yellow, normal) and PAM50 probabilities for patient-matched pairs. PAM50 probability shifts in metastases (if greater than 10%) are marked with black diamonds. (C) Correlation of patient-matched tumor expression similarity versus clinical time to metastasis, with Pearson r value and correlation P value.
Figure 3
Figure 3. Differentially expressed genes in patient-matched bone metastases.
(A) Heatmap (red, high relative expression; blue, low relative expression) of log2normCPM values from 207 differentially expressed genes (FDR-adjusted P value [padj] < 0.10, DESeq2) between primary tumors and patient-matched bone metastases. Heatmap is segregated into two sections; genes with log2 fold change >0 on top and genes with log2 fold change <0 on bottom. Each section is gene sorted by adjusted P values. (B) Disease-specific survival (DSS) outcome differences in ER-positive METABRIC tumors using boneMetSigUp (top) and boneMetSigDown (bottom) expression scores as strata. 95% confidence intervals are highlighted along with log-rank P values and associated risk tables.
Figure 4
Figure 4. Dysregulated gene sets and RBBP8 loss in breast cancer bone metastases.
(A) Top three enriched and depleted gene sets (by FDR q value) in bone metastases from ranked GSEA analysis (n = 11 pairs). Gene list ranking was performed using log2 fold change values from DESeq2 differential expression output, where a positive log2 fold change represents increased expression in metastasis (red) and a negative log2 fold change represents decreased expression in metastasis (blue). Green lines show running enrichment scores. Black vertical lines below curve show where genes within the query gene set are represented in the ranked list. Normalized enrichment score (NES) and FDR q values (derived from GSEA tool) are noted below gene set names. (B) RBBP8 expression values (log2normCPMs) in primary tumors (blue) and bone metastasis (red). Pairs are connected with a line and Wilcoxon signed-rank P value is shown. (C) Disease-specific survival (DSS) outcome differences in ER-positive tumors (METABRIC) and bone metastasis–free survival (BMFS) differences (GSE12276) using normalized RBBP8 expression values as strata. 95% confidence intervals are highlighted along with log-rank P values and risk tables.
Figure 5
Figure 5. Recurrent, clinically actionable expression gains and losses in ER-positive bone metastasis.
(A) Recurrent expression alteration losses, ranked by frequency, for each patient-matched case (columns, n = 11 cases). Each blue tile represents a bone metastasis with a lower log2 fold change vs. its matched primary than the case-specific expression loss threshold. Expression values (log2normCPMs) for most recurrent losses (PIK3C2G, ESR1) are pair plotted, with corresponding Wilcoxon signed-rank test P values noted. (B) Recurrent expression alteration gains, ranked by frequency. Red tiles represent bone metastases with higher log2 fold change than the case-specific expression gain thresholds. The two most recurrent expression gains (FGFR3, EPHA3) are also plotted with Wilcoxon signed-rank test P values.

References

    1. Ibrahim T, Mercatali L, Amadori D. A new emergency in oncology: Bone metastases in breast cancer patients (Review) Oncol Lett. 2013;6(2):306–310. - PMC - PubMed
    1. Weilbaecher KN, Guise TA, McCauley LK. Cancer to bone: a fatal attraction. Nat Rev Cancer. 2011;11(6):411–425. doi: 10.1038/nrc3055. - DOI - PMC - PubMed
    1. von Moos R, Haynes I. Where do bone-targeted agents RANK in breast cancer treatment? J Clin Med. 2013;2(3):89–102. doi: 10.3390/jcm2030089. - DOI - PMC - PubMed
    1. James JJ, et al. Bone metastases from breast carcinoma: histopathological - radiological correlations and prognostic features. Br J Cancer. 2003;89(4):660–665. doi: 10.1038/sj.bjc.6601198. - DOI - PMC - PubMed
    1. Zhang XH, Giuliano M, Trivedi MV, Schiff R, Osborne CK. Metastasis dormancy in estrogen receptor-positive breast cancer. Clin Cancer Res. 2013;19(23):6389–6397. doi: 10.1158/1078-0432.CCR-13-0838. - DOI - PMC - PubMed

Publication types