. 2017 Sep 7;2(17):e90874.
doi: 10.1172/jci.insight.90874.

Prevention of breast cancer skeletal metastases with parathyroid hormone

Affiliations

Prevention of breast cancer skeletal metastases with parathyroid hormone

Srilatha Swami et al. JCI Insight. .

Abstract

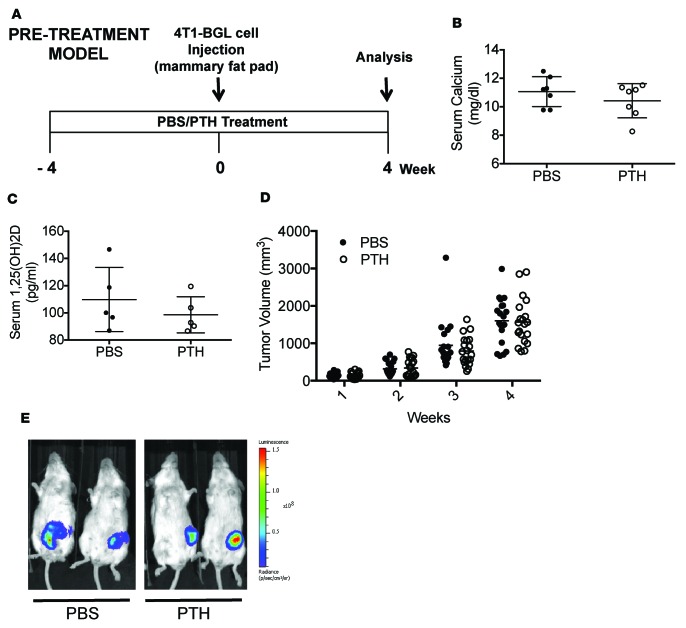
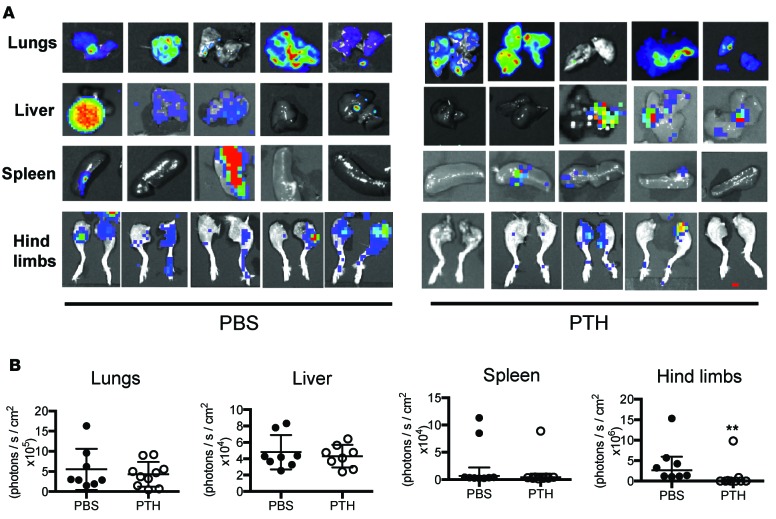
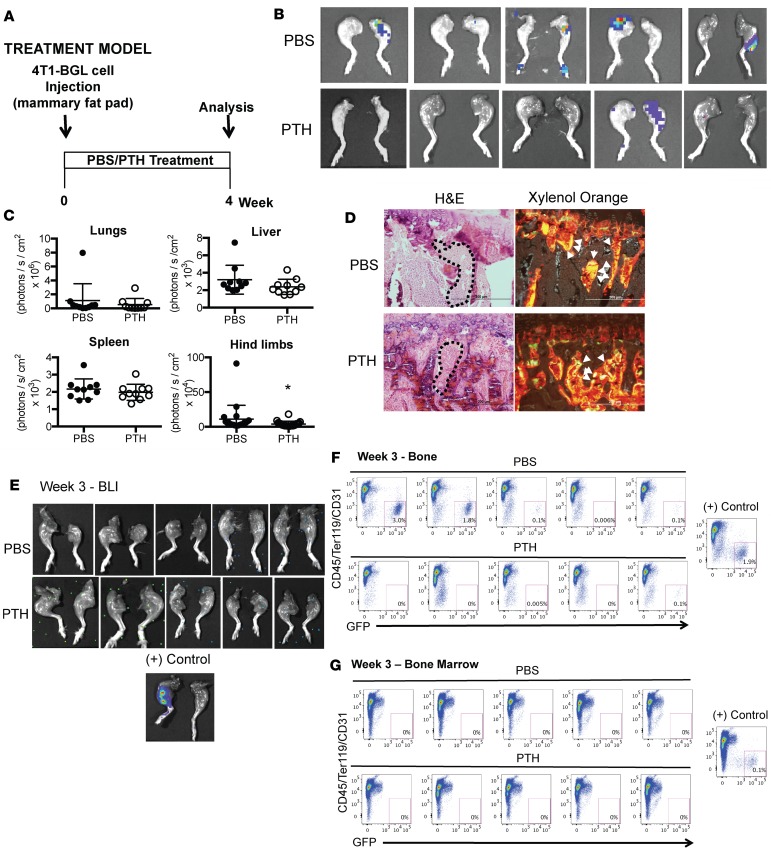
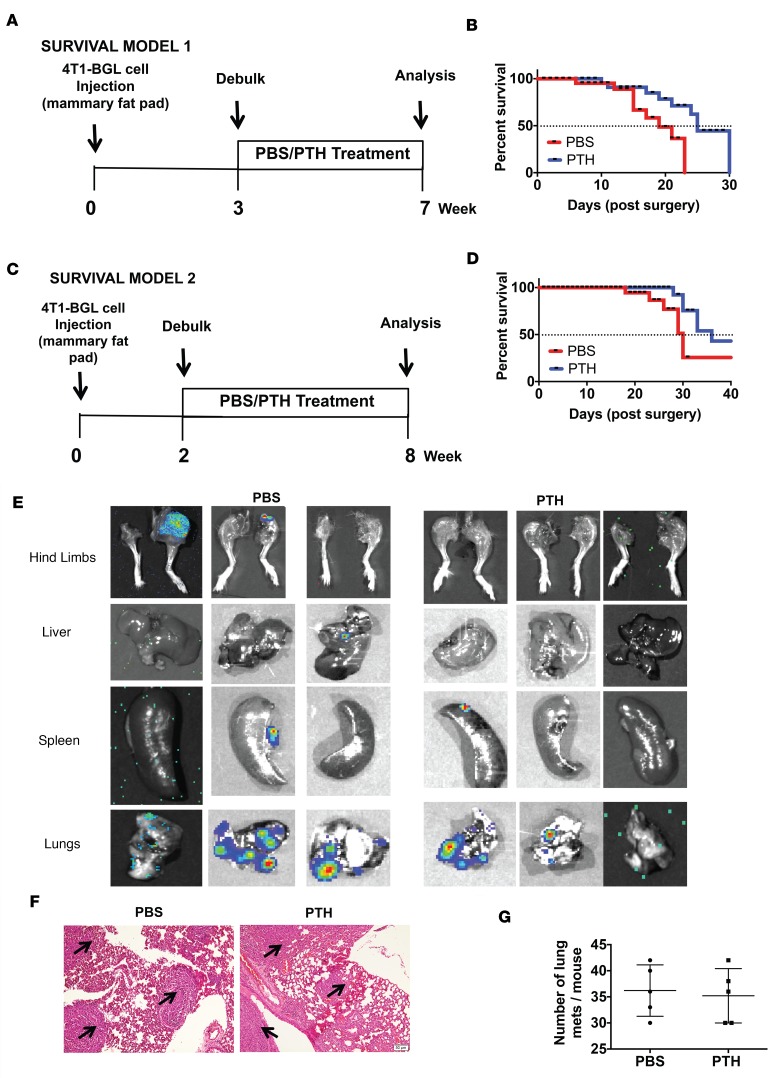
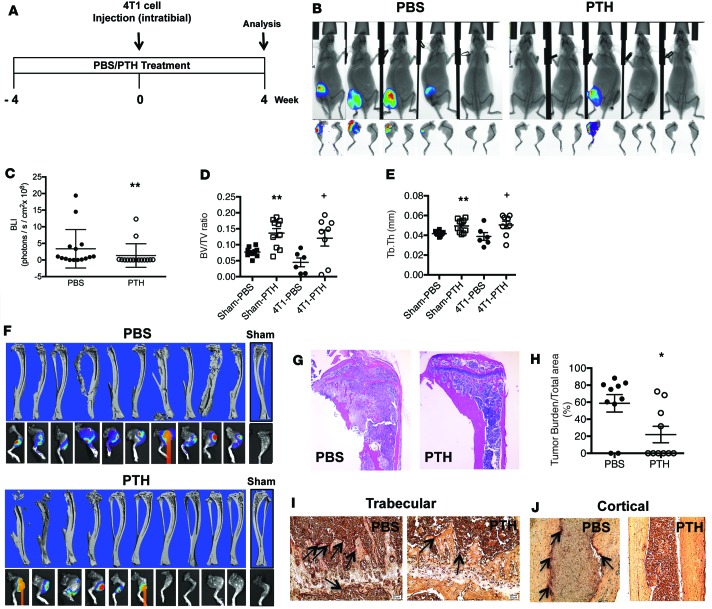
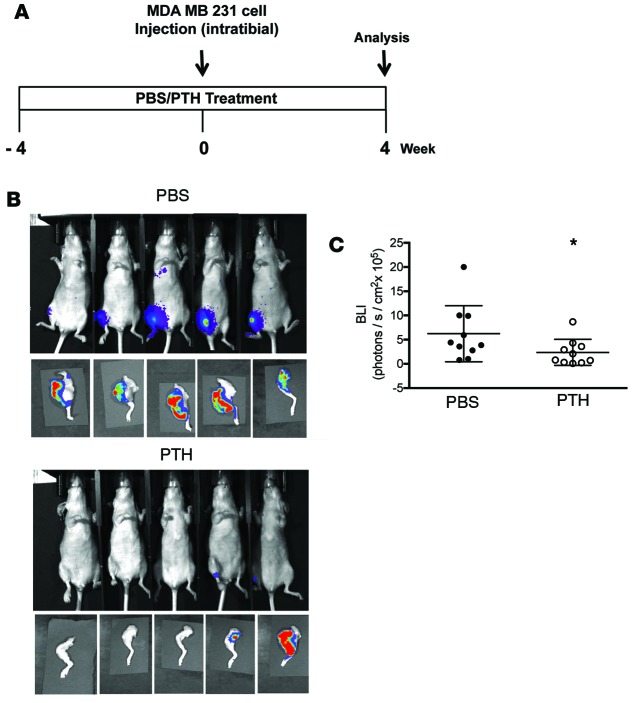
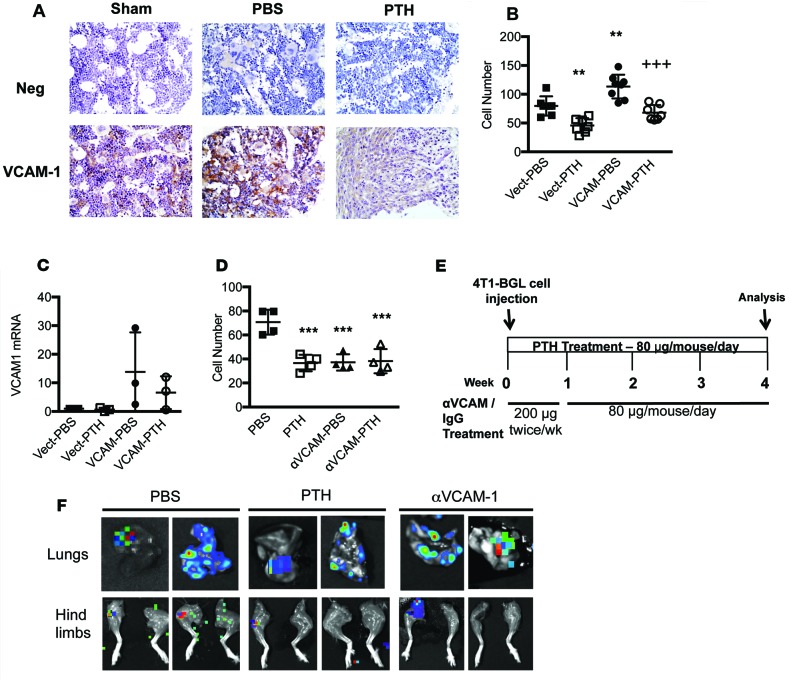
Advanced breast cancer is frequently associated with skeletal metastases and accelerated bone loss. Recombinant parathyroid hormone [teriparatide, PTH(1-34)] is the first anabolic agent approved in the US for treatment of osteoporosis. While signaling through the PTH receptor in the osteoblast lineage regulates bone marrow hematopoietic niches, the effects of anabolic PTH on the skeletal metastatic niche are unknown. Here, we demonstrate, using orthotopic and intratibial models of 4T1 murine and MDA-MB-231 human breast cancer tumors, that anabolic PTH decreases both tumor engraftment and the incidence of spontaneous skeletal metastasis in mice. Microcomputed tomography and histomorphometric analyses revealed that PTH increases bone volume and reduces tumor engraftment and volume. Transwell migration assays with murine and human breast cancer cells revealed that PTH alters the gene expression profile of the metastatic niche, in particular VCAM-1, to inhibit recruitment of cancer cells. While PTH did not affect growth or migration of the primary tumor, it elicited several changes in the tumor gene expression profile resulting in a less metastatic phenotype. In conclusion, PTH treatment in mice alters the bone microenvironment, resulting in decreased cancer cell engraftment, reduced incidence of metastases, preservation of bone microarchitecture and prolonged survival.

Keywords: Bone Biology; Bone disease; Breast cancer; G-protein coupled receptors; Oncology.


Conflict of interest statement

Conflict of interest: The authors have declared that no conflict of interest exists.

Figures

Figure 1
Figure 1. Pretreatment with intermittent PTH does not affect primary tumor growth in an orthotopic 4T1 murine breast cancer model.
(A) Prevention model experimental design. Mice were 6 weeks of age at the start of the experiment and 10 weeks at the time of 4T1 cell injection. (B) Serum calcium and (C) serum 1,25 (OH)2D levels from PBS- and PTH-treated mice. (D) End point tumor volumes. (E) Representative bioluminescence images (BLI) of mice bearing 4T1 tumors pretreated with intermittent PTH. All values represent mean ± SD of n = 20 for each group.
Figure 2
Figure 2. Pretreatment with intermittent PTH reduces skeletal metastases in an orthotopic 4T1 murine breast cancer model.
(A) Representative BLI images of metastases to lungs, liver, spleen, and hind limbs in the pretreatment model. (B) Quantitation of BLI in lungs, liver, spleen, and hind limbs with metastases. All values represent mean ± SD of n = 10 for each group. **P < 0.01 when compared with PBS group, by 1-way ANOVA with Bonferroni’s test as post-hoc analysis.
Figure 3
Figure 3. Intermittent PTH reduces skeletal metastases in a treatment model of 4T1 murine breast cancer.
(A) Treatment model experimental design. Mice were 10 weeks old at the time of 4T1 cell injection (B) Representative BLI images of metastases to the hind limbs in the treatment model. (C) Quantitation of BLI in lungs, liver, spleen, and hind limbs with metastases in the treatment model. (D) Representative sections of double calcein labeling in hind limbs with metastases from mice treated with PBS/PTH. Sections are stained with xylene orange to visualize calcein labeling (indicated with white arrowheads) or H&E to visualize corresponding histology (areas of tumor are indicated with dotted lines). Scale bar: 200 μm. (E) BLI at week 3 following PBS and PTH treatment in tumor-bearing mice (n = 5) in mice prior to flow cytometry. (F) Flow cytometry for detection of GFP+ 4T1 cells in bones of PBS- and PTH-treated mice (n = 5). In mice treated with PBS, GFP+ 4T1 cells were detected in the hind limb bones of 1 of 5 animals at weeks 1 and 2 and in 5 of 5 mice at week 3. In PTH-treated mice, GFP+ 4T1 cells were detected in 0 of 5 mice at weeks 1 and 2 and in 2 of 5 mice at week 3. Hind limbs injected intratibially with 4T1 cells were used as positive (+) controls. (G) Flow cytometry for detection of GFP+ 4T1 cells in bone marrow (n = 5). No GFP+ 4T1 cells were detected by flow cytometry in bone marrow from any of the 5 PBS- or PTH-treated mice at weeks 1, 2, or 3. All values represent mean ± SD. *P < 0.05 when compared with PBS-treated group, by 1-way ANOVA with Bonferroni’s test as post-hoc analysis.
Figure 4
Figure 4. Treatment with intermittent PTH prolongs survival in mice undergoing tumor debulking surgery.
(A) Survival model 1 experimental design (n = 10). Mice were 10 weeks old at the time of tumor cell injections (B) Kaplan-Meier plots to assess survival after debulking of primary tumors in model 1. Median survival of PBS-treated mice was 19 days and that of PTH-treated mice was 25 days (P = 0.0183, log-rank [Mantel-Cox] test). (C) Survival model 2 experimental design (n = 10). (D) Kaplan-Meier plots to assess survival after debulking of primary tumors in model 2. Median survival of PBS-treated mice was 30 days and that of PTH-treated mice was 36 days (P = 0.029, log-rank [Mantel-Cox] test). (E) Representative BLI imaging of skeletal and other distal organs at end point. (F) H&E staining (areas of tumor are indicated with arrows) and (G) macroscopic examination of lungs at end point from mice in survival model 2 at end point. Scale bar: 200 μm. All values represent mean ± SD for each group.
Figure 5
Figure 5. Intermittent PTH decreases 4T1 mouse breast cancer cell engraftment to the bone, leading to better preservation of bone architecture.
(A) Intratibial injection experimental design. Mice were 6 weeks of age at the start of the experiment and 10 weeks at the time of 4T1 cell injection. (B) Representative end point BLI images of hind limbs injected with 4T1 murine breast cancer cells. After 4 weeks, tumors were identified by BLI imaging in 7 of 15 PTH-treated mice compared with 14 of 15 in the PBS-treated mice (P = 0.005). (C) Quantitation of BLI 4 weeks after intratibial injections of 4T1 cells. Architectural analyses of proximal tibia (D) bone volume/total volume (BV/TV) and (E) trabecular thickness (Tb.Th) by μCT (n = 10). (F) Representative reconstructed 3D μCT images of tibiae with corresponding BLI images at end point in PBS- and PTH-treated mice following intratibial injections of 4T1 cells. (G) Representative H&E-stained images of tibia from PBS- and PTH-treated mice with intratibial injections of 4T1 cells (original magnification, ×4). (H) Quantitation of tumor burden. Representative TRAP staining of (I) trabecular region (original magnification, ×20) and (J) cortical region (original magnification, ×10) from tibiae of mice treated with PBS/PTH with intratibial injections of 4T1 cells. TRAP-positive osteoclasts are indicated by arrows. All values represent mean ± SD of n = 10 for each group. *P < 0.05, **P < 0.01 when compared with PBS group, by 1-way ANOVA with Bonferroni’s test as post-hoc analysis.
Figure 6
Figure 6. Pretreatment with intermittent PTH reduces MDA-MB-231 human breast cancer cell engraftment in bone.
(A) Intratibial injection experimental design. Mice were 6 weeks of age at the start of the experiment and 10 weeks at the time of 4T1 cell injection. (B) Representative end point BLI images of hind limbs injected with MDA-MB-231 human breast cancer cells. After 4 weeks, tumors were identified in 5 of 15 PTH-treated mice compared with 11 of 15 PBS-treated mice (P = 0.027, by 1-way ANOVA with Bonferroni’s test as post-hoc analysis). (C) Quantitation of BLI 4 weeks after intratibial injections of MDA cells. All values represent mean ± SD of n = 15 for each group. *P < 0.05, when compared with PBS group, by 1-way ANOVA with Bonferroni’s test as post-hoc analysis.
Figure 7
Figure 7. In vitro treatment with intermittent PTH attenuates the migratory potential of breast cancer cells by altering the gene expression profile in preosteoblastic MC3T3-E1 cells.
Numbers of breast cancer cells (4T1 and MDA) that migrated towards MC3T3-E1 preosteoblastic cells treated with (A) continuous PTH, (B) intermittent PTH, or (C) conditioned media from cells treated with intermittent PTH in a Transwell migration system. (D) Target gene expression in MC3T3-E1 cells using gene-specific primers. (E) RT2 Profiler Tumor PCR Metastasis PCR Array analysis of MC3T3-E1 gene expression. (F) Genes with >2 fold changes from Table 3 were further validated with real-time quantitative PCR. (G) CXCL12 protein levels in MC3T3-E1 cells treated with control or PTH in the absence or presence of 4T1 cells. All values represent mean ± SEM of at least 3 individual experiments conducted in triplicate. *P < 0.05, **P < 0.01, ***P < 0.001, ****P < 0.0001 when compared with control (con) group. +++P < 0.001 when compared with control (+4T1), by 1-way ANOVA with Bonferroni’s test as post-hoc analysis.
Figure 8
Figure 8. Decrease in VCAM-1 expression reduces the migratory potential of 4T1 breast cancer cells both in vitro and in vivo.
(A) Representative VCAM-1 staining in sham-, PBS-, and PTH-treated tibiae with 4T1 cells (original magnification, ×40) (n = 6). (B) Numbers of 4T1 cells that migrated towards MC3T3-E1 cells overexpressing VCAM-1 treated with intermittent PTH or PBS in Transwell assays (n = 8). (C) Vcam1 mRNA levels in MC3T3-E1 cells overexpressing VCAM-1 and treated with intermittent PTH or PBS. (D) Numbers of 4T1 cells that migrated towards MC3T3-E1 cells treated with VCAM-1–neutralizing antibody (20 μg/ml) and intermittent PTH in Transwell assays (n = 5). (E) In vivo treatment with anti-VCAM-1 antibody experimental design (n = 10). (F) Representative BLI images of metastases to lungs and hind limbs. All values represent mean ± SD of at least 3 individual experiments conducted in triplicate. **P < 0.01, ***P < 0.001 when compared with PBS group. +++P < 0.001 when compared with VCAM-PBS group, by 1-way ANOVA with Bonferroni’s test as post-hoc analysis.
Figure 9
Figure 9. PTH administration does not affect 4T1 cell growth in vitro or tumor progression in BALB/c mice.
(A) DNA content in 4T1 cells treated with increasing concentrations of intermittent PTH for 6 days. (B) 4T1 cells were treated with intermittent PTH (6 of 24 hours) and allowed to migrate against a serum gradient in a Transwell assay. All values represent mean ± SD of at least 3 individual experiments conducted in triplicate. Scale bar: 200 μm. (C) Representative BLI at end point and (D) weekly tumor volume in mice injected with 4T1 cells and treated with PTH (treatment model) for 4 weeks. (E) Expression of select target genes in primary tumors dissected from mice pretreated with PTH, as described in Figure 1A. (F) Representative CXCR7 staining in primary tumors treated with PTH, as described in Figure 1A (original magnification, ×40). All values represent mean ± SD (n = 10) for each group. **P < 0.01, ***P < 0.001 when compared with PBS group, by 1-way ANOVA with Bonferroni’s test as post-hoc analysis.

References

    1. Siegel RL, Miller KD, Jemal A. Cancer statistics, 2015. CA Cancer J Clin. 2015;65(1):5–29. doi: 10.3322/caac.21254. - DOI - PubMed
    1. Eckhardt BL, Francis PA, Parker BS, Anderson RL. Strategies for the discovery and development of therapies for metastatic breast cancer. Nat Rev Drug Discov. 2012;11(6):479–497. doi: 10.1038/nrd2372. - DOI - PubMed
    1. Coleman RE. Clinical features of metastatic bone disease and risk of skeletal morbidity. Clin Cancer Res. 2006;12(20 Pt 2):6243s–6249s. - PubMed
    1. Kiel MJ, Morrison SJ. Uncertainty in the niches that maintain haematopoietic stem cells. Nat Rev Immunol. 2008;8(4):290–301. doi: 10.1038/nri2279. - DOI - PubMed
    1. Nakamura Y, et al. Isolation and characterization of endosteal niche cell populations that regulate hematopoietic stem cells. Blood. 2010;116(9):1422–1432. doi: 10.1182/blood-2009-08-239194. - DOI - PubMed

Publication types

Substances