. 2017 Sep 6;8(1):463.
doi: 10.1038/s41467-017-00623-3.

Reconstructing cell cycle and disease progression using deep learning

Affiliations

Reconstructing cell cycle and disease progression using deep learning

Philipp Eulenberg et al. Nat Commun. .

Abstract

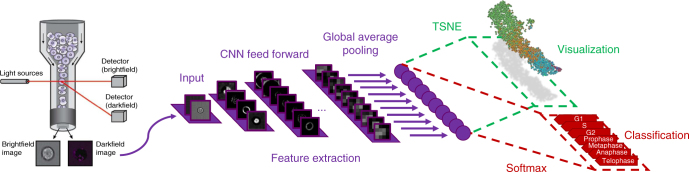
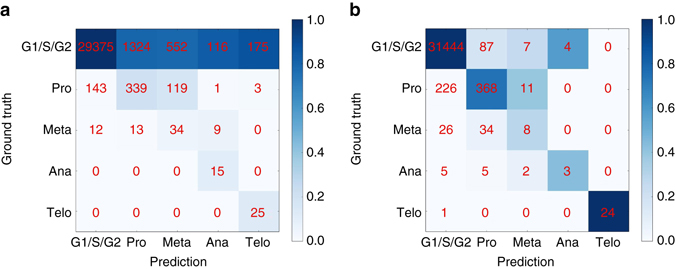
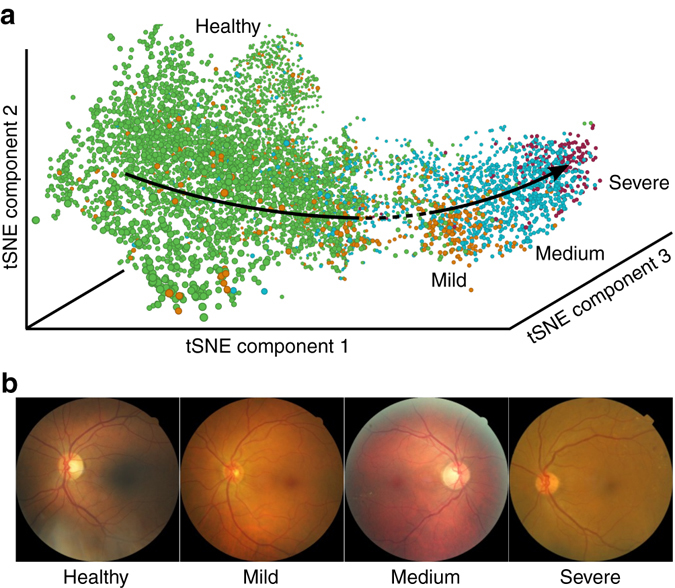
We show that deep convolutional neural networks combined with nonlinear dimension reduction enable reconstructing biological processes based on raw image data. We demonstrate this by reconstructing the cell cycle of Jurkat cells and disease progression in diabetic retinopathy. In further analysis of Jurkat cells, we detect and separate a subpopulation of dead cells in an unsupervised manner and, in classifying discrete cell cycle stages, we reach a sixfold reduction in error rate compared to a recent approach based on boosting on image features. In contrast to previous methods, deep learning based predictions are fast enough for on-the-fly analysis in an imaging flow cytometer.The interpretation of information-rich, high-throughput single-cell data is a challenge requiring sophisticated computational tools. Here the authors demonstrate a deep convolutional neural network that can classify cell cycle status on-the-fly.


Conflict of interest statement

The authors declare no competing financial interests.

Figures

Fig. 1
Fig. 1
Overview of analysis workflow. Images from all channels of a high-throughput microscope are uniformly resized and directly fed into the neural network, which is trained using categorical labels. The learned features are used for both classification and visualization
Fig. 2
Fig. 2
Representative images for the cell cycle stages as measured in brightfield, darkfield, and fluorescence channels. Seven cell cycle stages define seven classes. We only show one representative image for the interphase classes G1, S, and G2, which can hardly be distinguished by eye
Fig. 3
Fig. 3
Cell-cycle reconstruction and detection of abnormal cells. a tSNE visualization of the validation data set in activation space representation. All interphase classes (G1, S, G2) and the two mitotic phases with the highest number of representatives are shown (Prophase: red, Metaphase: blue). Telophase and Anaphase are not visible due to their low number representatives. b tSNE visualization of data from the interphase classes (G1, S, G2) in activation space. The color map now shows the DNA content of cells. A cluster of damaged cells is indicated with an arrow. c Randomly picked representatives from the bulk of undamaged cells. d Randomly picked representatives from the cluster of damaged cells
Fig. 4
Fig. 4
Exemplary activation patterns of intermediate layers. Plotted are activations after the second convolutional module for examples of single cells from four different phases: a G1, b G2, c Anaphase, and d Telophase. The response maps mark regions of high activation. Map 1 responds to the cell boundaries. Map 2 responds to the internal area of the cells. Map 3 extracts the localized scatter intensities. Map 4 constitutes a cross-channel feature, which correlates with the difference of map 2 and 3
Fig. 5
Fig. 5
Confusion matrices for boosting and deep learning for classification of five classes. To compare with previous work, the three interphase phases (G1, S, G2) are treated as a single class. Red numbers denote absolute numbers of cells in each entry of the confusion matrix, that is, diagonal elements correspond to precision. Coloring of the matrix is obtained by normalizing absolute numbers to column sums. a Boosting, which leads to 92.35% accuracy. b Deep learning, which leads to 98.73% ± 0.16% accuracy
Fig. 6
Fig. 6
Reconstruction of disease progression in diabetic retinopathy. a tSNE visualization of activation space representation, colored according to the disease states. b Randomly chosen images for each class

References

    1. Pepperkok R, Ellenberg J. High-throughput fluorescence microscopy for systems biology. Nat. Rev. Mol. Cell Biol. 2006;7:690–696. doi: 10.1038/nrm1979. - DOI - PubMed
    1. Basiji DA, Ortyn WE, Liang L, Venkatachalam V, Morrissey P. Cellular image analysis and imaging by flow cytometry. Clin. Lab. Med. 2007;27:653–670. doi: 10.1016/j.cll.2007.05.008. - DOI - PMC - PubMed
    1. Brown M, Wittwer C. Flow cytometry: principles and clinical applications in hematology. Clin. Chem. 2000;46:1221–1229. - PubMed
    1. Eliceiri KW, et al. Biological imaging software tools. Nat. Methods. 2012;9:697–710. doi: 10.1038/nmeth.2084. - DOI - PMC - PubMed
    1. Blasi T, et al. Label-free cell cycle analysis for high-throughput imaging flow cytometry. Nat. Commun. 2016;7:10256. doi: 10.1038/ncomms10256. - DOI - PMC - PubMed

Publication types