. 2017 Sep 6;8(1):465.
doi: 10.1038/s41467-017-00493-9.

APOBEC3A is an oral cancer prognostic biomarker in Taiwanese carriers of an APOBEC deletion polymorphism

Affiliations

APOBEC3A is an oral cancer prognostic biomarker in Taiwanese carriers of an APOBEC deletion polymorphism

Ting-Wen Chen et al. Nat Commun. .

Abstract

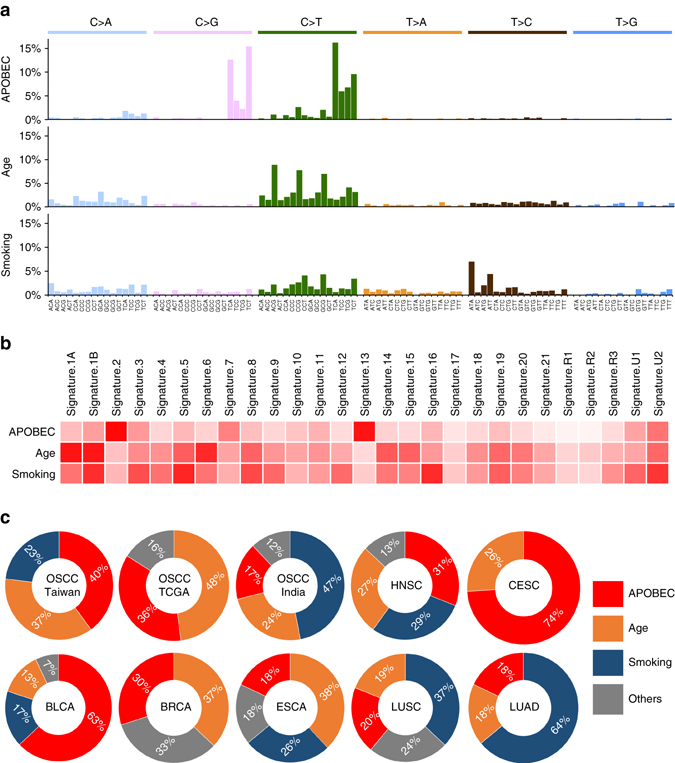
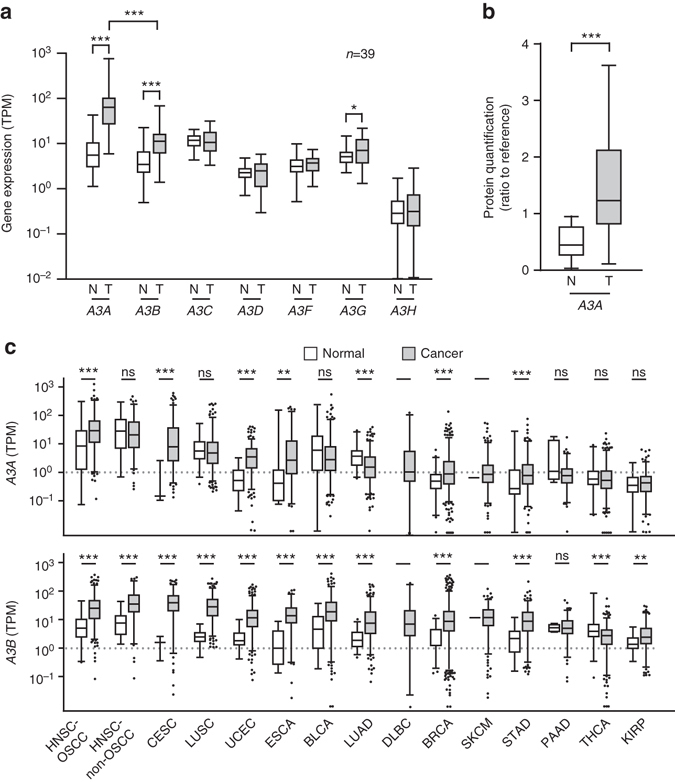
Oral squamous cell carcinoma is a prominent cancer worldwide, particularly in Taiwan. By integrating omics analyses in 50 matched samples, we uncover in Taiwanese patients a predominant mutation signature associated with cytidine deaminase APOBEC, which correlates with the upregulation of APOBEC3A expression in the APOBEC3 gene cluster at 22q13. APOBEC3A expression is significantly higher in tumors carrying APOBEC3B-deletion allele(s). High-level APOBEC3A expression is associated with better overall survival, especially among patients carrying APOBEC3B-deletion alleles, as examined in a second cohort (n = 188; p = 0.004). The frequency of APOBEC3B-deletion alleles is ~50% in 143 genotyped oral squamous cell carcinoma -Taiwan samples (27A3B -/-:89A3B +/-:27A3B +/+), compared to the 5.8% found in 314 OSCC-TCGA samples. We thus report a frequent APOBEC mutational profile, which relates to a APOBEC3B-deletion germline polymorphism in Taiwanese oral squamous cell carcinoma that impacts expression of APOBEC3A, and is shown to be of clinical prognostic relevance. Our finding might be recapitulated by genomic studies in other cancer types.Oral squamous cell carcinoma is a prevalent malignancy in Taiwan. Here, the authors show that OSCC in Taiwanese show a frequent deletion polymorphism in the cytidine deaminases gene cluster APOBEC3 resulting in increased expression of A3A, which is shown to be of clinical prognostic relevance.


Conflict of interest statement

The authors declare no competing financial interests.

Figures

Fig. 1
Fig. 1
An integrated deep-sequencing approach identifies novel variant features underlying OSCC of a unique demographic origin. Summary data for the 50 OSCC-Taiwan cases. The four blocks correspond to the different types of data attributes. They represent, from top to bottom: a Mutation analyses in a series of 50 OSCC samples. The y-axis shows the number of mutation events and the omics data (DNA exome sequencing, RNA RNA-Seq, CCP comprehensive cancer panel), whereas the x-axis indicates the samples of the individual patients. b Heatmap representation of individual genes exhibiting somatic mutations in the 50 OSCC samples. The q-values (false discovery rates) represent the significance of each mutated gene, as determined using MutSigCV. c Heatmap representation of the copy number variations, compared with those from TCGA and India. SNVs were identified with Mutect, which applies a Bayesian classifier to detect mutations with allelic fractions of 0.1 or less ( < 10%). For the number of mutation events, the mutation types are broken down by the indicated sequence features. For the mutation b and copy number analyses c, the tables on the right show the percentages of patients with the respective somatic sequence variation or amplification/deletion, as found in the OSCC-Taiwan (TW), OSCC-TCGA (TCGA), and OSCC-India (India) cohorts. NA data not available. d The risk exposure and A3B deletion genotypes. OSCC patients with the habits of alcohol, betel nut or cigarette are individually marked. For 3 APOBEC3B genotypes, A3B −/−, A3B +/−, and A3B +/+ are shown with full, half and empty squares, respectively
Fig. 2
Fig. 2
Mutational signature analysis of OSCC-Taiwan. a Three distinct mutational signatures were identified by our OSCC whole-exome sequencing. The spectra of base changes representing APOBEC (signatures 2/13), age (signature 1), and smoking (signature 4/5) are shown. The x-axis indicates the 96 combinations of trinucleotide motifs, while the y-axis represents the relative coefficient of the detected signature. b Heatmap of cosine-similarity results for the mutation spectrums of OSCC-Taiwan, coded by color. The cosine-similarity score, which ranges from 0 to 1, represents the extent of similarity to a particular signature. Among the 27 mutational signatures, the APOBEC, age, and smoking signatures are the most significant mutational signatures detected in OSCC samples (dark red). c The three overrepresented mutation signatures described in a were compared among datasets representing OSCC from Taiwan, India, and TCGA, as well as other TCGA tumor types carrying APOBEC-associated signatures. OSCC-TCGA is a subset of the HNSC (head and neck squamous cell carcinoma) data archived in TCGA. CESC, BLCA, BRCA, ESCA, LUSC, and LUAD correspond to cervical squamous cell carcinoma, bladder urothelial carcinoma, breast invasive carcinoma, esophageal carcinoma, lung squamous cell carcinoma, and lung adenocarcinoma, respectively
Fig. 3
Fig. 3
APOBEC3 gene expression is altered in OSCC. a The mRNA expression levels of all seven APOBEC3 genes in our paired OSCC samples were determined by RNA-Seq. The y-axis shows the TPM (transcripts per million) of each gene in paired tissue samples. N, adjacent normal tissue; T, tumor tissues. The expression profiles illustrate the tumor-specific up-regulations of A3A, A3B (p < 0.0001, Mann–Whitney U-test), and A3G (p = 0.02, Mann–Whitney U-test). In tumors, A3A was expressed at a higher level than A3B (p < 0.001). b A3A-specific peptides were identified in tissue proteomes using iTRAQ-mass spectrometry. The y axis represents the protein level relative to a common reference. A3A-specific peptides were significantly higher (~3 fold) in tumor tissues compared with corresponding normal tissues (p < 0.001, Mann-Whitney U-test). Of the 38 N/T paired tissues analyzed, we detected A3A peptides in 35 normal tissue samples and 36 tumor tissue samples. c Expression levels of A3A and A3B in different TCGA cancer types. Only cancers reported to have APOBEC-mutation signatures were included in this plot; they are ordered according to the A3A expression levels in their tumors. The y-axis shows the TPM of our RNA-Seq data for the A3A and A3B genes. The HNSC samples were further grouped into OSCC and ‘others’ (HNSC-non-OSCC). UCEC, DLBC, SKCM, STAD, PAAD, THCA, KIRP, CESC, BLCA, BRCA, ESCA, LUSC, and LUAD correspond to uterine corpus endometrial carcinoma, lymphoid neoplasm diffuse large B-cell lymphoma, skin cutaneous melanoma, stomach adenocarcinoma, pancreatic adenocarcinoma, thyroid carcinoma, kidney renal papillary cell carcinoma, cervical squamous cell carcinoma, bladder urothelial carcinoma, breast invasive carcinoma, esophageal carcinoma, lung squamous cell carcinoma and lung adenocarcinoma, respectively. Box plots show the distribution of expression of indicated APOBEC genes. Boxes extend from the third (Q3) to the first (Q1) quartile, with the line at the median; whiskers extend to 2.5 and 97.5 percentiles
Fig. 4
Fig. 4
The deletion polymorphism of the A3A-A3B genomic locus and upregulation of A3A and A3B in OSCC-Taiwan. a Schematic depiction of the gene structures and genomic organizations of the deletion polymorphism (top) and non-deleted (bottom) versions of the APOBEC3A-APOBEC3B genomic locus. The deletion variant (APOBEC3A_B genotype) arises from a 29.5-kb genomic deletion spanning from the 3’UTR of A3A to the eighth exon of A3B. PCR-based genotyping analysis was used to distinguish non-deletion and deletion alleles according to the size of the amplified product (449 and 757 bp, respectively). A3B +/+, A3B +/−, and A3B −/− represent non-carrier individuals and those heterozygous and homozygous for the deletion allele, respectively. b Genotype-biased expressional alterations of A3A and A3B in OSCC. Based on RNA-Seq-determined TPM values (y-axis), the mRNA expression levels of A3A (left) and A3B (right) were determined in the initial cohort of 39 paired samples (N, adjacent normal tissues; T, tumor). Patients are grouped according to their APOBEC3B-deletion genotypes, with the number of patients in each group (n) indicated at the top. c Genotype-specific relative expression of A3A in tumor (T) vs. normal tissue (N) samples, as determined by RT-PCR. The y-axis represents the expression level of A3A (or A3B) relative to that of TBP (TATA binding protein gene). Individuals of the A3B −/− genotype exhibited a greater tumor-specific upregulation of A3A compared with those of the A3B +/− genotype (p = 0.0354) (*p < 0.05; **p < 0.001; ***p < 0.0001, Wilcoxon signed-rank test). Box plots show the distribution of expression of indicated APOBEC genes. Boxes extend from the third (Q3) to the first (Q1) quartile, with the line at the median; whiskers extend to 2.5 and 97.5 percentiles
Fig. 5
Fig. 5
Kaplan–Meier plot for overall survival (OS) by A3A and A3B expression and genotype in OSCC-Taiwan and OSCC-TCGA. a Kaplan–Meier plot showing that the 10-year OS rates for patient subgroups stratified by high vs. low A3A expression were 85.1% and 65.9%, respectively (p = 0.004) in the OSCC-Taiwan data set, whereas no significant difference was found in the OSCC-TCGA data set (p = 0.239). b No significant difference in OS was found for subgroups stratified according to A3B expression (right) in the OSCC-Taiwan and OSCC-TCGA datasets. c Kaplan–Meier plot for OS in subgroups stratified by A3A expression among the 143 patients in the OSCC-Taiwan data set. High A3A in patients with the A3B +/− (n = 89) and A3B −/− (n = 27) genotypes, but not the A3B +/+ (n = 27) genotype, was significantly correlated with better OS. d Kaplan–Meier plot for OS in subgroups stratified by A3A expression among the 312 patients in the OSCC-TCGA data set. No significant correlation was found in patients with the A3B +/+ (n = 278) or A3B +/− (n = 34) genotypes. The y-axis shows the probability of OS according to high and low A3A expression. The survival rate was estimated by Kaplan–Meier plotting and compared by log-rank test; all p-values are two-sided, with the significance level set at p < 0.05

References

    1. Chi AC, Day TA, Neville BW. Oral cavity and oropharyngeal squamous cell carcinoma--an update. CA Cancer. J. Clin. 2015;65:401–421. doi: 10.3322/caac.21293. - DOI - PubMed
    1. Global Burden of Disease Cancer C et al. The global burden of cancer 2013. JAMA Oncol. 2015;1:505–527. doi: 10.1001/jamaoncol.2015.0735. - DOI - PMC - PubMed
    1. Taiwan Cancer Registry. Health Promotion Administration, Ministry of Health and Welfare, Taiwan. Available: http://tcr.cph.ntu.edu.tw/main.php?Page=A1. Accessed 6 May 2015.
    1. Ko YC, Huang YL, Lee CH, Chen MJ, Lin LM, Tsai CC. Betel quid chewing, cigarette smoking and alcohol consumption related to oral cancer in Taiwan. J. Oral. Pathol. Med. 1995;24:450–453. doi: 10.1111/j.1600-0714.1995.tb01132.x. - DOI - PubMed
    1. Sharan RN, Mehrotra R, Choudhury Y, Asotra K. Association of betel nut with carcinogenesis: revisit with a clinical perspective. PLoS ONE. 2012;7:e42759. doi: 10.1371/journal.pone.0042759. - DOI - PMC - PubMed

Publication types

MeSH terms