

A fluorescence-based reporter for monitoring expression of mycobacterial cytochrome bd in response to antibacterials and during infection
- PMID: 28878275
- PMCID: PMC5587683
- DOI: 10.1038/s41598-017-10944-4
A fluorescence-based reporter for monitoring expression of mycobacterial cytochrome bd in response to antibacterials and during infection
Abstract
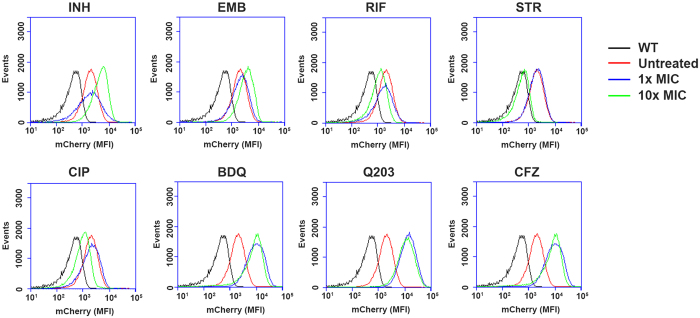
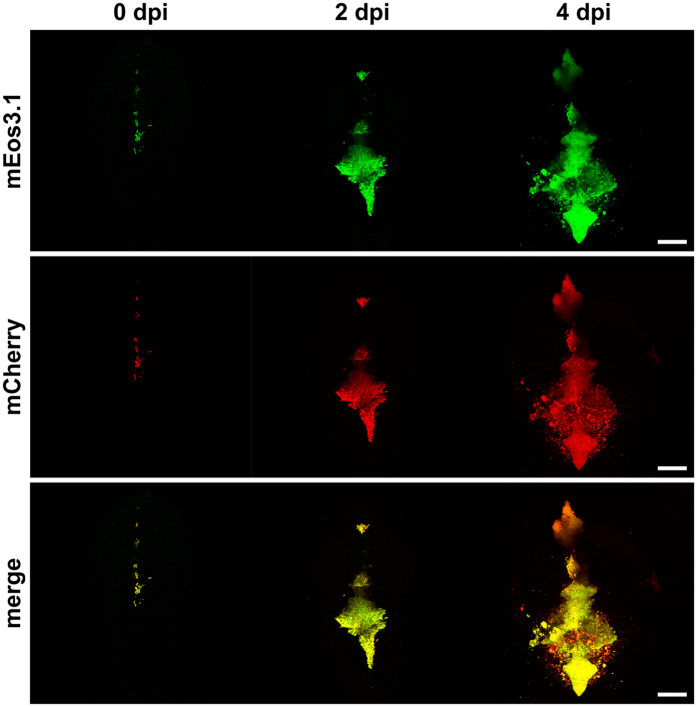
Cytochrome bd is a component of the oxidative phosphorylation pathway in many Gram-positive and Gram-negative bacteria. Next to its role as a terminal oxidase in the respiratory chain this enzyme plays an important role as a survival factor in the bacterial stress response. In Mycobacterium tuberculosis and related mycobacterial strains, cytochrome bd is an important component of the defense system against antibacterial drugs. In this report we describe and evaluate an mCherry-based fluorescent reporter for detection of cytochrome bd expression in Mycobacterium marinum. Cytochrome bd was induced by mycolic acid biosynthesis inhibitors such as isoniazid and most prominently by drugs targeting oxidative phosphorylation. We observed no induction by inhibitors of protein-, DNA- or RNA-synthesis. The constructed expression reporter was suitable for monitoring mycobacterial cytochrome bd expression during mouse macrophage infection and in a zebrafish embryo infection model when using Mycobacterium marinum. Interestingly, in both these infection models cytochrome bd levels were considerably higher than during in vitro culturing of M. marinum. The expression reporter described here can be a valuable tool for elucidating the role of cytochrome bd as a survival factor.
Conflict of interest statement
The authors declare that they have no competing interests.
Figures


Similar articles
-
Cytochrome bd in Mycobacterium tuberculosis: A respiratory chain protein involved in the defense against antibacterials.Prog Biophys Mol Biol. 2020 May;152:55-63. doi: 10.1016/j.pbiomolbio.2019.11.002. Epub 2019 Nov 15. Prog Biophys Mol Biol. 2020. PMID: 31738981 Review.
-
Exploiting the synthetic lethality between terminal respiratory oxidases to kill Mycobacterium tuberculosis and clear host infection.Proc Natl Acad Sci U S A. 2017 Jul 11;114(28):7426-7431. doi: 10.1073/pnas.1706139114. Epub 2017 Jun 26. Proc Natl Acad Sci U S A. 2017. PMID: 28652330 Free PMC article.
-
Cytochrome bd oxidase, oxidative stress, and dioxygen tolerance of the strictly anaerobic bacterium Moorella thermoacetica.J Bacteriol. 2005 Mar;187(6):2020-9. doi: 10.1128/JB.187.6.2020-2029.2005. J Bacteriol. 2005. PMID: 15743950 Free PMC article.
-
Susceptibility of Mycobacterium tuberculosis Cytochrome bd Oxidase Mutants to Compounds Targeting the Terminal Respiratory Oxidase, Cytochrome c.Antimicrob Agents Chemother. 2017 Sep 22;61(10):e01338-17. doi: 10.1128/AAC.01338-17. Print 2017 Oct. Antimicrob Agents Chemother. 2017. PMID: 28760899 Free PMC article.
-
Comparative pathogenesis of Mycobacterium marinum and Mycobacterium tuberculosis.Cell Microbiol. 2008 May;10(5):1027-39. doi: 10.1111/j.1462-5822.2008.01133.x. Epub 2008 Feb 20. Cell Microbiol. 2008. PMID: 18298637 Review.
Cited by
-
Mycobacterium tuberculosis Toxin CpnT Is an ESX-5 Substrate and Requires Three Type VII Secretion Systems for Intracellular Secretion.mBio. 2021 Mar 2;12(2):e02983-20. doi: 10.1128/mBio.02983-20. mBio. 2021. PMID: 33653883 Free PMC article.
-
Phenotypic adaptation of Mycobacterium tuberculosis to host-associated stressors that induce persister formation.Front Cell Infect Microbiol. 2022 Sep 27;12:956607. doi: 10.3389/fcimb.2022.956607. eCollection 2022. Front Cell Infect Microbiol. 2022. PMID: 36237425 Free PMC article. Review.
-
Bacterial Oxidases of the Cytochrome bd Family: Redox Enzymes of Unique Structure, Function, and Utility As Drug Targets.Antioxid Redox Signal. 2021 Jun 1;34(16):1280-1318. doi: 10.1089/ars.2020.8039. Epub 2020 Nov 9. Antioxid Redox Signal. 2021. PMID: 32924537 Free PMC article. Review.
-
Usnic acid impacts energy production and iron metabolism in Mycobacterium tuberculosis H37Rv.mSystems. 2025 May 20;10(5):e0025625. doi: 10.1128/msystems.00256-25. Epub 2025 Apr 9. mSystems. 2025. PMID: 40202336 Free PMC article.
-
Heterologous Expression of ethA and katG in Mycobacterium marinum Enables the Rapid Identification of New Prodrugs Active against Mycobacterium tuberculosis.Antimicrob Agents Chemother. 2021 Mar 18;65(4):e01445-20. doi: 10.1128/AAC.01445-20. Print 2021 Mar 18. Antimicrob Agents Chemother. 2021. PMID: 33495223 Free PMC article.
References
Publication types
MeSH terms
Substances
LinkOut - more resources
Full Text Sources
Other Literature Sources
Medical
