. 2017 Sep 6;8(1):447.
doi: 10.1038/s41467-017-00453-3.

Multivariate discovery and replication of five novel loci associated with Immunoglobulin G N-glycosylation

Affiliations

Multivariate discovery and replication of five novel loci associated with Immunoglobulin G N-glycosylation

Xia Shen et al. Nat Commun. .

Abstract

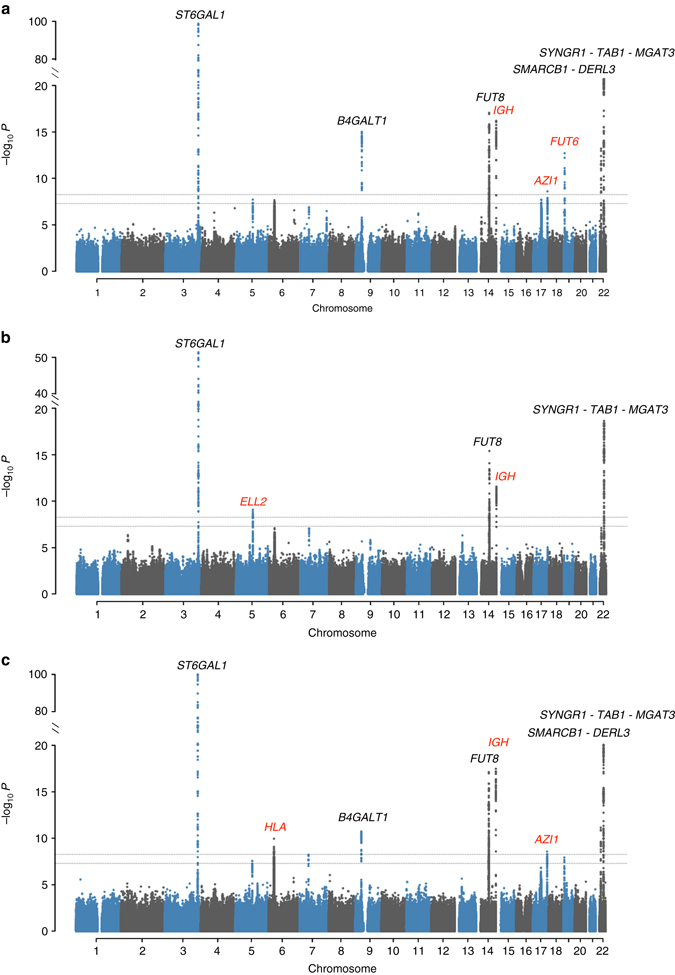
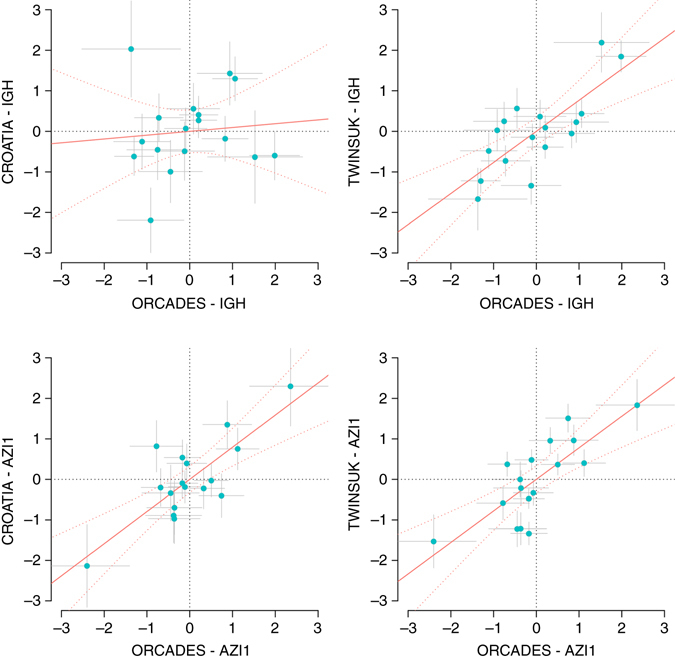
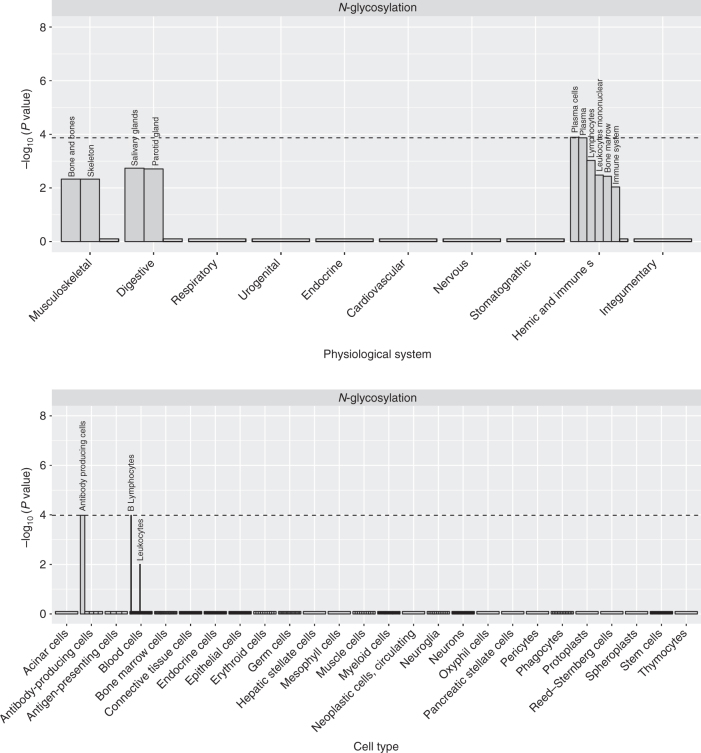
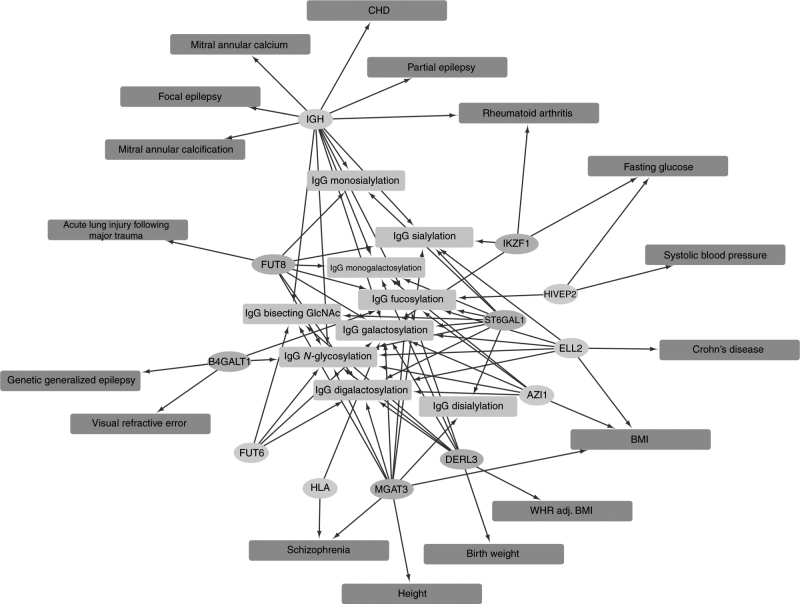
Joint modeling of a number of phenotypes using multivariate methods has often been neglected in genome-wide association studies and if used, replication has not been sought. Modern omics technologies allow characterization of functional phenomena using a large number of related phenotype measures, which can benefit from such joint analysis. Here, we report a multivariate genome-wide association studies of 23 immunoglobulin G (IgG) N-glycosylation phenotypes. In the discovery cohort, our multi-phenotype method uncovers ten genome-wide significant loci, of which five are novel (IGH, ELL2, HLA-B-C, AZI1, FUT6-FUT3). We convincingly replicate all novel loci via multivariate tests. We show that IgG N-glycosylation loci are strongly enriched for genes expressed in the immune system, in particular antibody-producing cells and B lymphocytes. We empirically demonstrate the efficacy of multivariate methods to discover novel, reproducible pleiotropic effects.Multivariate analysis methods can uncover the relationship between phenotypic measures characterised by modern omic techniques. Here the authors conduct a multivariate GWAS on IgG N-glycosylation phenotypes and identify 5 novel loci enriched in immune system genes.


Conflict of interest statement

The authors declare no competing financial interests. G.L. has multiple patents in the field of glycoscience issued. Y.S.A. is a director and co-owner of Maatschap PolyOmica, which provides (consulting) services in the area of (statistical) (gen)omics.

Figures

Fig. 1
Fig. 1
Manhattan plots of multivariate GWAS for IgG N-glycosylation phenotypes in the ORCADES discovery population. The known and novel loci are labeled in black and red, respectively. 23 IgG N-glycosylation phenotypes were analyzed together and also in eight different functional subgroups, including sialylation and galactosylation. a Analysis of 23 N-glycosylation traits; b Analysis of eight sialylation phenotypes; c Analysis of 17 galactosylation phenotypes. The horizontal dashed lines represent the genome-wide significant P-value threshold of 5×10⁻⁸/9 = 5.6×10⁻⁹ and the genome-wide suggestive significant threshold of 5×10⁻⁸
Fig. 2
Fig. 2
Comparison of the estimated genotype–phenotype partial correlations between discovery and replication cohorts. The IGH and AZI1 loci for the 17 traits in the IgG galactosylation group are displayed. The partial correlations were standardized to z-scores so that the regression slope and confidence intervals (red curves) represent the amount of correlation in the effect sizes between each named cohort. The gray bars represent standard errors
Fig. 3
Fig. 3
DEPICT enrichment analysis results for IgG N-glycosylation loci. (a) Tissues. (b) Cell types. Genes in the associated loci are highly expressed in cells and structures of the hemic and immune systems (with emphasis on antibody-producing cells), and to a lesser degree in the skeleton and glands of the digestive system. See Supplementary Data 2 for details
Fig. 4
Fig. 4
Pleiotropic network of the novel (orange) and known (blue) loci discovered using the multivariate method. The IgG N-glycosylation phenotypes are shown in light green and complex traits/disease in red. The associations with complex traits were filtered based on an FDR cutoff of 5%. CAD, coronary heart disease; BMI, body mass index; WHR adj BMI, waist–hip ratio adjusted for BMI

References

    1. Solovieff N, Cotsapas C, Lee PH, Purcell SM, Smoller JW. Pleiotropy in complex traits: challenges and strategies. Nat. Rev. Genet. 2013;14:483–495. doi: 10.1038/nrg3461. - DOI - PMC - PubMed
    1. Marchini J, Howie B, Myers S, McVean G, Donnelly P. A new multipoint method for genome-wide association studies by imputation of genotypes. Nat. Genet. 2007;39:906–913. doi: 10.1038/ng2088. - DOI - PubMed
    1. Ferreira M, Purcell SM. A multivariate test of association. Bioinformatics. 2007;25:132–133. doi: 10.1093/bioinformatics/btn563. - DOI - PubMed
    1. Shriner D. Moving toward system genetics through multiple trait analysis in genome-wide association studies. Front. Genet. 2012;3:1. doi: 10.3389/fgene.2012.00001. - DOI - PMC - PubMed
    1. Astle W, Balding DJ. Population structure and cryptic relatedness in genetic association studies. Stat. Sci. 2009;24:451–471. doi: 10.1214/09-STS307. - DOI

Publication types

MeSH terms

Substances