. 2017 Aug 23:8:1008.
doi: 10.3389/fimmu.2017.01008. eCollection 2017.

RTS,S/AS01E Malaria Vaccine Induces Memory and Polyfunctional T Cell Responses in a Pediatric African Phase III Trial

Affiliations

RTS,S/AS01E Malaria Vaccine Induces Memory and Polyfunctional T Cell Responses in a Pediatric African Phase III Trial

Gemma Moncunill et al. Front Immunol. .

Abstract

Comprehensive assessment of cellular responses to the RTS,S/AS01E vaccine is needed to understand potential correlates and ultimately mechanisms of protection against malaria disease. Cellular responses recognizing the RTS,S/AS01E-containing circumsporozoite protein (CSP) and Hepatitis B surface antigen (HBsAg) were assessed before and 1 month after primary vaccination by intracellular cytokine staining and 16-color flow cytometry in 105 RTS,S/AS01-vaccinated and 74 rabies-vaccinated participants (controls) in a pediatric phase III trial in Africa. RTS,S/AS01E-vaccinated children had significantly higher frequencies of CSP- and HBsAg-specific CD4+ T cells producing IL-2, TNF-α, and CD40L and HBsAg-specific CD4+ T producing IFN-γ and IL-17 than baseline and the control group. Vaccine-induced responses were identified in both central and effector memory (EM) compartments. EM CD4+ T cells expressing IL-4 and IL-21 were detected recognizing both vaccine antigens. Consistently higher response rates to both antigens in RTS,S/AS01E-vaccinated than comparator-vaccinated children were observed. RTS,S/AS01E induced polyfunctional CSP- and HBsAg-specific CD4+ T cells, with a greater degree of polyfunctionality in HBsAg responses. In conclusion, RTS,S/AS01E vaccine induces T cells of higher functional heterogeneity and polyfunctionality than previously characterized. Responses detected in memory CD4+ T cell compartments may provide correlates of RTS,S/AS01-induced immunity and duration of protection in future correlates of immunity studies.

Keywords: Plasmodium falciparum; T cells; cellular immune responses; flow cytometry; intracellular cytokine staining; malaria; vaccine.


Figures
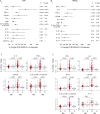
Figure 1
Figure 1
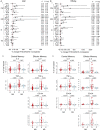
CSP- and hepatitis B surface antigen (HBsAg)-specific CD4+ T cell responses induced by RTS,S/AS01E. CSP- (A) and HBsAg- (B) specific CD4+ T cells expressing the common functional markers of both intracellular cytokine staining panels. (i) Forest plot showing the overall effect of RTS,S/AS01E (R) vaccination from baseline (M0) to 1 month post-third immunization (M3) taking into account the M0–M3 changes in comparator (C) vaccinees. The % change between RTS,S/AS01E and comparator vaccinees taking into account M0–M3 changes and 95% confidence intervals shown were obtained with a multivariate linear mixed effect model. P values (P) were obtained through likelihood ratio test and were adjusted for multiple testing (P-Adj) through Holm’s approach. (ii) Box plots showing the frequencies of CD4+ T cells expressing the functional markers after background subtraction found to be statistically significant in (i). Boxplots illustrate the medians and the 25th and 75th quartiles, and whiskers display 1.5 times interquartile ranges, outliers are not shown to facilitate visualization of the differences between comparison groups. Differences between vaccine groups at M0 and at M3 and differences from M0 to M3 within each vaccine group were computed through a multivariate linear mixed effect model and P values obtained through likelihood ratio test and were adjusted for multiple testing through Holm approach. Only significant P values adjusted for multiple testing are shown. Sample size in (A), for markers detected by both staining panels N = 100 RTS,S/AS01E and 65 comparator at M0, 100 RTS,S/AS01E and 70 comparator at M3. For comparisons including M0 and M3, only subjects that had samples at both timepoints are included (N = 156 for markers detected by both panels, N = 83 for markers detected by panel 1, N = 73 for markers detected by panel 2). Sample size in (B) N = 62 RTS,S/AS01E and 36 comparator at M0, 67 RTS,S/AS01E and 50 comparator at M3. For IL-17 (detected by panel 2) N = 30 RTS,S/AS01E and 18 comparator at M0, 37 RTS,S/AS01E and 27 comparator at M3. For comparisons including M0 and M3, only subjects that had samples at both timepoints are included (N = 71 for markers detected by both panels, N = 35 for markers detected by panel 1, N = 36 for markers detected by panel 2).
Figure 2
Figure 2
CSP- and hepatitis B surface antigen (HBsAg)-specific CD4+ T cell memory responses induced by RTS,S/AS01E. CSP- (A) and HBsAg- (B) specific memory CD4+ T cell subsets [central memory (CM); effector memory (EM); naive (N); terminally differentiated (TD)] expressing functional markers measured in the intracellular cytokine staining panels panel 1. (i) Forest plot showing the overall effect of RTS,S/AS01E (R) vaccination from baseline (M0) to 1 month post-third immunization (M3) taking into account the M0–M3 changes in comparator (C) vaccinees. The % change between RTS,S/AS01E and comparator vaccinees and 95% confidence intervals shown were obtained with a multivariate linear mixed effect model. P values (P) were obtained through likelihood ratio test and were adjusted for multiple testing (P-Adj) through Benjamini–Hochberg approach. (ii) Box plots showing the frequencies of CD4+ TCM and CD4+ TEM cells expressing selected functional markers after background subtraction. Boxplots illustrate the medians and the 25th and 75th quartiles, and whiskers display 1.5 times interquartile ranges, outliers are not shown to facilitate visualization of the differences between comparison groups. Differences between vaccine groups at M0 and at M3 and differences from M0 to M3 within each vaccine group were computed through a multivariate linear mixed effect model and P values obtained through likelihood ratio test and were adjusted for multiple testing through Holm approach. Only significant P values adjusted for multiple testing are shown. Sample size in (A) For N = 53 RTS,S/AS01E and 35 comparator at M0, 52 RTS,S/AS01E and 39 comparator at M3. For comparisons including M0 and M3, only subjects that had samples at both timepoints are included (N = 83). Sample size in (B) N = 32 RTS,S/AS01E and 18 comparator at M0, 37 RTS,S/AS01E and 27 comparator at M3. For comparisons including M0 and M3, only subjects that had samples at both timepoints are included (N = 35).
Figure 3
Figure 3
Non-specific CD4+ T and CD8+ T cell responses induced by RTS,S/AS01E as determined by the difference between M0 and M3 for the control stimulation. Frequencies in control stimulations (stimulation with the peptide diluent, DMSO, considered background) of CD4+ T cells (A) and CD8+ T cells (B) expressing the common functional markers of both intracellular cytokine staining panels and also functional markers measured separately in each panel. (i) Forest plot showing the overall effect of RTS,S/AS01E (R) vaccination from baseline (M0) to 1 month post-third immunization (M3) taking into account the M0–M3 changes in comparator (C) vaccinees. The % change between RTS,S/AS01E and comparator vaccinees and 95% confidence intervals shown were obtained with a multivariate linear mixed effect model. P values (P) were obtained through likelihood ratio test and were adjusted for multiple testing (P-Adj) through Holm approach. (ii) Box plots showing the frequencies of T cells expressing functional markers when significant differences were detected. Boxplots illustrate the medians and the 25th and 75th quartiles, and whiskers display 1.5 times interquartile ranges, outliers are not shown to facilitate visualization of the differences between comparison groups. Differences between vaccine groups at M0 and at M3 and differences from M0 to M3 within each vaccine group were computed through a multivariate linear mixed effect model and P values obtained through likelihood ratio test and were adjusted for multiple testing through Holm approach. Only significant P values adjusted for multiple testing are shown. Sample size in (A) for markers detected by both staining panels N = 100 RTS,S/AS01E and 65 comparator at M0, 101 RTS,S/AS01E and 70 comparator at M3. For CD107a (detected by panel 2), N = 47 RTS,S/AS01E and 30 comparator at M0, 49 RTS,S/AS01E and 31 comparator at M3. For comparisons, including M0 and M3, only subjects that had samples at both timepoints are included (N = 157 for markers detected by both panels, N = 83 for markers detected by panel 1 and N = 74 for markers detected by panel 2). Sample size in (B) for markers common from both staining panels N = 100 RTS,S/AS01E and 64 comparator at M0, 99 RTS,S/AS01E and 69 comparator at M3. For CD107a N = 47 RTS,S/AS01E and 30 comparator at M0, 47 RTS,S/AS01E and 31 comparator at M3. For comparisons including M0 and M3, only subjects that had samples at both timepoints are included (N = 154 for markers detected by both panels, N = 82 for markers detected by panel 1 and N = 742 for markers detected by panel 2).
Figure 4
Figure 4
CSP- (A) and hepatitis B surface antigen (HBsAg)-specific (B) CD4+ T cell polyfunctional responses. (i) Box plots of functionality and polyfunctionality scores calculated by combinatorial polyfunctionality analysis of antigen-specific T cell subsets (COMPASS), stratified by vaccine group and timepoint. The functionality score represents the estimated proportion of cell subsets showing positive responses among all possible cell subsets expressing any functional marker, whereas the polyfunctional score is similar but it is weighted by the degree of polyfunctionality. Boxplots illustrate the medians and the 25th and 75th quartiles, and whiskers display 1.5 times interquartile ranges. COMPASS analysis was performed using the common markers of both panels and all subjects with data (IL-4, IFN-γ, granzyme B (GzB), IL-2, TNF-α, CD154, 64 possible subsets). P values computed through Wilcoxon tests and adjusted for multiple testing through Holm approach separately for CSP and HBsAg antigens are shown. (ii) Heatmap of COMPASS posterior probabilities showing CD4+ T cell responses to CSP and HBsAg in RTS,S/AS01E and comparator vaccinees at pre-vaccination (M0) and 1 month post-third vaccination (M3). Columns represent functional cell subsets with detectable antigen-specific responses, color coded by the number of functional markers they express and are ordered by increasing degree of polyfunctionality. Rows represent study children, which are stratified by vaccine status, at the top the comparator vaccinees and at the bottom the RTS,S/AS01E vaccinees. Each cell shows the probability (color coded by purple intensity) that the corresponding child shows an antigen-specific response in the corresponding cell subset. Sample size in (A) N = 100 RTS,S/AS01E and 65 comparator at M0, 100 RTS,S/AS01E and 70 comparator at M3; (B) N = 62 RTS,S/AS01E and 36 comparator at M0, 67 RTS,S/AS01E and 50 comparator at M3.

References

    1. WHO. World Malaria Report 2016. Geneva: WHO; (2016).
    1. RTS,S Clinical Trials Partnership. Agnandji ST, Lell B, Fernandes JF, Abossolo BP, Methogo BG, et al. A phase 3 trial of RTS,S/AS01 malaria vaccine in African infants. N Engl J Med (2012) 367:2284–95.10.1056/NEJMoa1208394 - DOI - PMC - PubMed
    1. Agnandji ST, Lell B, Soulanoudjingar SS, Fernandes JF, Abossolo BP, Conzelmann C, et al. First results of phase 3 trial of RTS,S/AS01 malaria vaccine in African children. N Engl J Med (2011) 365:1863–75.10.1056/NEJMoa1102287 - DOI - PubMed
    1. RTS,S Clinical Trials Partnership. Efficacy and safety of RTS,S/AS01 malaria vaccine with or without a booster dose in infants and children in Africa: final results of a phase 3, individually randomised, controlled trial. Lancet (2015) 386:31–45.10.1016/S0140-6736(15)60721-8 - DOI - PMC - PubMed
    1. Barbosa A, Naniche D, Aponte JJ, Manaca MN, Mandomando I, Aide P, et al. Plasmodium falciparum-specific cellular immune responses after immunization with the RTS,S/AS02D candidate malaria vaccine in infants living in an area of high endemicity in Mozambique. Infect Immun (2009) 77:4502–9.10.1128/IAI.00442-09 - DOI - PMC - PubMed