. 2017 Aug 23:8:1430.
doi: 10.3389/fpls.2017.01430. eCollection 2017.

Transcriptomic Analysis Reveals Candidate Genes for Female Sterility in Pomegranate Flowers

Affiliations

Transcriptomic Analysis Reveals Candidate Genes for Female Sterility in Pomegranate Flowers

Lina Chen et al. Front Plant Sci. .

Abstract

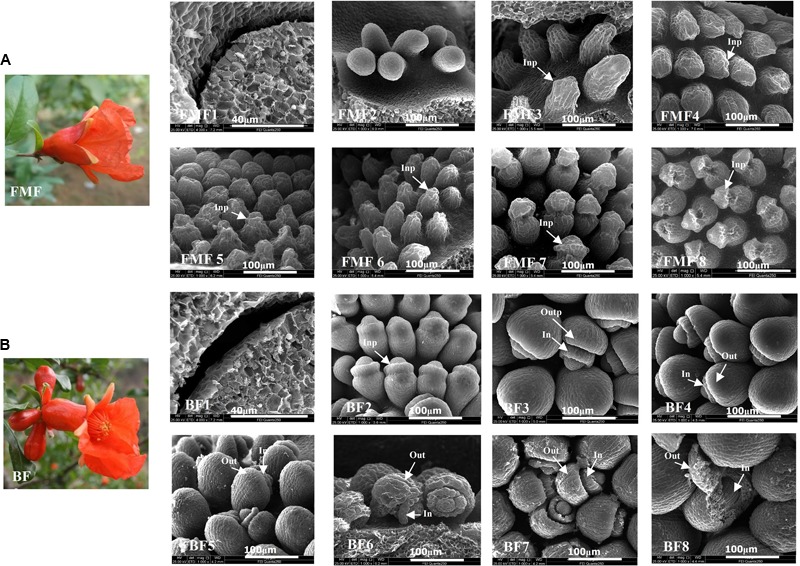
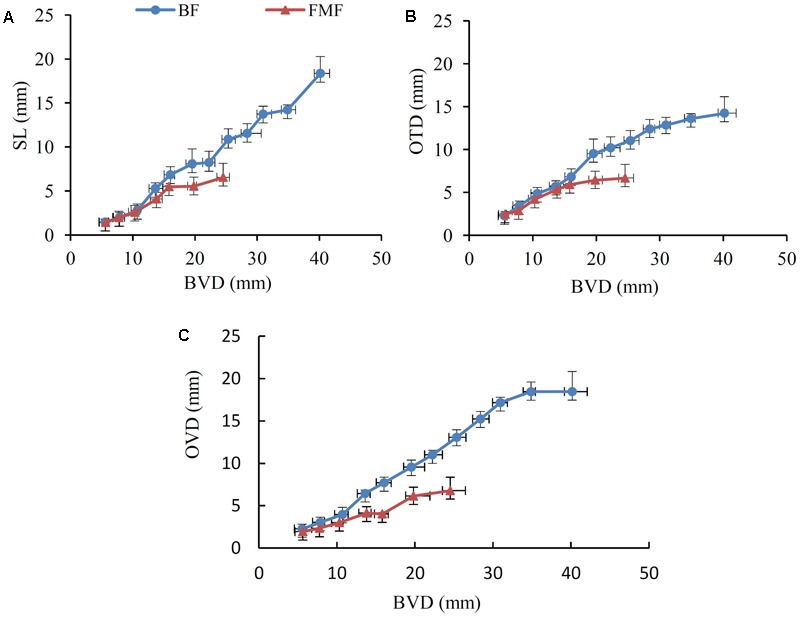
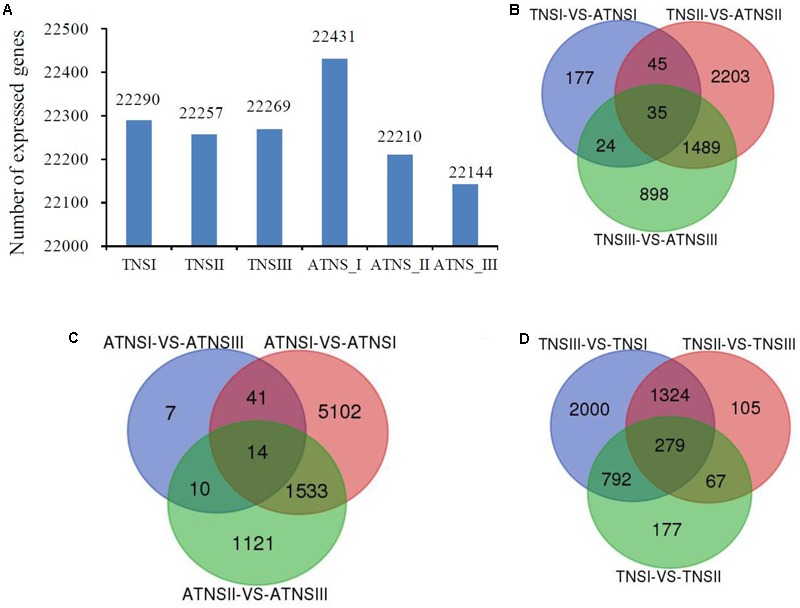
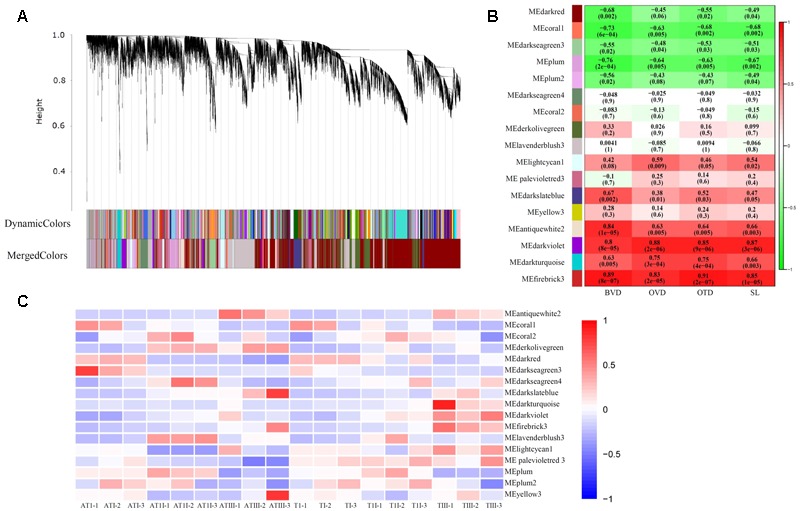
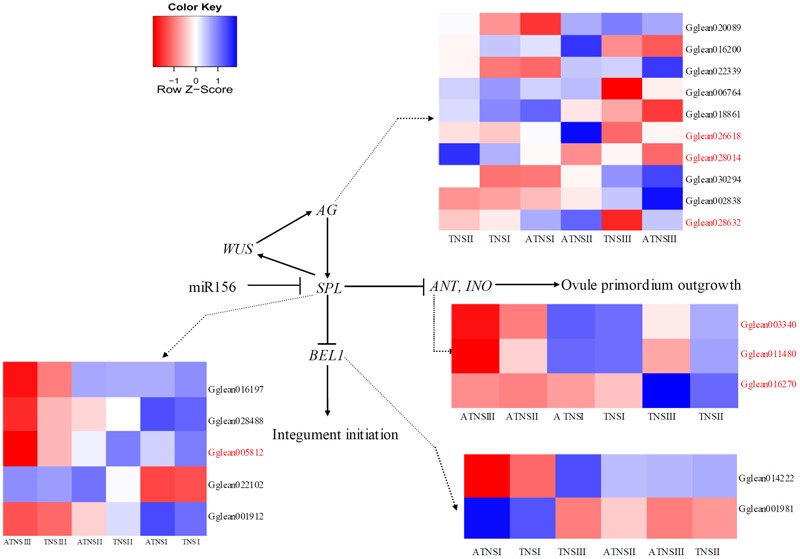
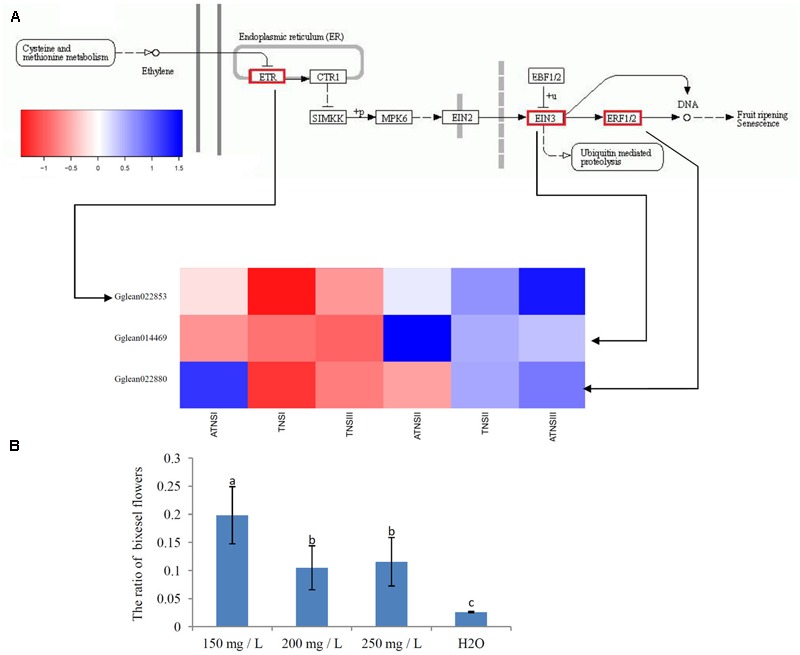
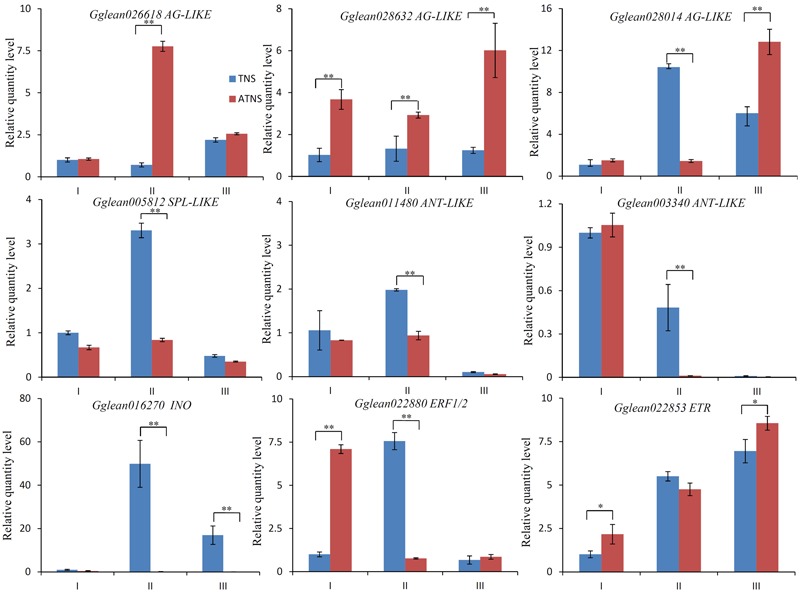
Pomegranate has two types of flowers on the same plant: functional male flowers (FMF) and bisexual flowers (BF). BF are female-fertile flowers that can set fruits. FMF are female-sterile flowers that fail to set fruit and that eventually drop. The putative cause of pomegranate FMF female sterility is abnormal ovule development. However, the key stage at which the FMF pomegranate ovules become abnormal and the mechanism of regulation of pomegranate female sterility remain unknown. Here, we studied ovule development in FMF and BF, using scanning electron microscopy to explore the key stage at which ovule development was terminated and then analyzed genes differentially expressed (differentially expressed genes - DEGs) between FMF and BF to investigate the mechanism responsible for pomegranate female sterility. Ovule development in FMF ceased following the formation of the inner integument primordium. The key stage for the termination of FMF ovule development was when the bud vertical diameter was 5.0-13.0 mm. Candidate genes influencing ovule development may be crucial factors in pomegranate female sterility. INNER OUTER (INO/YABBY4) (Gglean016270) and AINTEGUMENTA (ANT) homolog genes (Gglean003340 and Gglean011480), which regulate the development of the integument, showed down-regulation in FMF at the key stage of ovule development cessation (ATNSII). Their upstream regulator genes, such as AGAMOUS-like (AG-like) (Gglean028014, Gglean026618, and Gglean028632) and SPOROCYTELESS (SPL) homolog genes (Gglean005812), also showed differential expression pattern between BF and FMF at this key stage. The differential expression of the ethylene response signal genes, ETR (ethylene-resistant) (Gglean022853) and ERF1/2 (ethylene-responsive factor) (Gglean022880), between FMF and BF indicated that ethylene signaling may also be an important factor in the development of pomegranate female sterility. The increase in BF observed after spraying with ethephon supported this interpretation. Results from qRT-PCR confirmed the findings of the transcriptomic analysis.

Keywords: Punica granatum L.; bisexual flowers; female sterility; functional male flowers; transcriptomic analysis.


Figures

FIGURE 1
FIGURE 1
Scanning electron micrographs (SEM) and photographs showing the developmental stages of the functional male flowers (FMF) ovule and bisexual flowers (BF) ovule. (A) The morphologies of FMF, (B) the morphologies of BF. (FMF1–8) The ovule development of FMF when their bud vertical diameter (BVD) was 3.0–5.0, 5.1–10.0, 10.1–13.0, 13.1–15.0, 15.1–18.0, 18.1–21.0, and 21.1–25.0 mm, flowering time (BVD ≥ 25.1 mm). (BF1–8) represented the ovule development of BF when their BVD was 3.0–5.0, 5.1–10.0, 10.1–13.0, 13.1–15.0, 15.1–18.0, 18.1–21.0, and 21.1–25.0 mm, flowering time (BVD > 25.1 mm).
FIGURE 2
FIGURE 2
Changing curve of style length (SL), ovary transverse diameter (OTD), and ovary vertical diameter (OVD) of BF and functionally male flowers of ‘Tunisiruanzi’ with BVD. (A) Changing curve of SL with BVD. (B) Changing curve of OTD with BVD. (C) Changing curve of OVD with BVD. SL, style length; OTD, ovary transverse diameter; OVD, ovary vertical diameter. Transverse error bars means standard deviation of BVD, vertical error bars means standard deviation of SL OVD and OTD. Each data point represents the mean value of 10 technical replicates.
FIGURE 3
FIGURE 3
The number of different expressed genes. (A) Different number of expressed genes in different stages. (B–D) Unique and shared DEGs among different stages for both BF and FMF. TNSI, TNSII, TNSIII represent pistil of BFs when their BVD was 3.0–5.0, 5.1–13.0, and 13.1–25.0 mm, respectively. ATNSI, ATNSII, ATNSIII stand for pistil of FMFs when their BVD was 3.0–5.0, 5.1–13.0, and 13.1–25.0 mm, respectively. (B) The number of DEGs between ATNSI -VS- TNSI, ATNSII -VS- TNSII, ATNSIII -VS- TNSIII. (C) The number of DEGs between ATNSI -VS- ATNSII, ATNSI -VS- ATNSIII, ATNSII -VS- ATNSIII; (D) The number of DEGs between TNSI -VS- TNSII, TNSI -VS- TNSIII, TNSII -VS- TNSIII; Venn diagrams were drawn using a online tool Venn Diagrams (http://bioinformatics.psb.ugent.be/webtools/Venn/). BF, bisexual flowers; FMF, functional male flowers. VS in B–D represent versus.
FIGURE 4
FIGURE 4
Genes co-expression network analysis with WGCNA. (A) Hierarchical cluster tree of different co-expression modules. Each branch constitute one module, and each leaf in the branches represented one gene. A total of 17 distinct modules were labeled by different colors. (B) Module-trait association. Each row corresponds to a module. Each column amount to a trait. BVD, bud vertical diameter; OTD, ovary transverse diameter; OVD, ovary vertical diameter; SL, style length. The color at the right represented the size of correlation coefficient, the digital labels in the box in B stand for correlation coefficient (r) (upside) and test value (P-value) (bottom). Those modules with r > 0.6, P-value < 0.05 were selected to discuss. (C) Module-tissue association. Each row corresponds to a module. Each column amount to a tissue. The color of each box at the row/column intersection showed the size of correlation coefficient between the module and the tissue type. ATI, ATII, ATIII represented pistil of FMF when their BVD was 3.0–5.0, 5.1–13.0, and 13.1–25.0 mm. TI, TII, TIII represented pistil of BF when their BVD was 3.0–5.0, 5.1–13.0, and 13.1–25.0 mm.
FIGURE 5
FIGURE 5
Expression of candidate genes involved in ovule development. Gene expression was measured by log2Ratio. ATNSI, ATNSII, ATNSIII represented pistil of FMF when their BVD was 3.0–5.0, 5.1–13.0, and 13.1–25.0 mm. TNSI, TNSII, TNSIII represented pistil of BF when their BVD was 3.0–5.0, 5.1–13.0, and 13.1–25.0 mm. Gene ID highlighted in red represent DEGs in ATNSII-TNSII comparison. Different colors from blue to red showed the relative log2 (expression ratio).
FIGURE 6
FIGURE 6
Expression of candidate genes involved in ovule development. (A) Expression of candidate genes involved in ethylene signal transduction. Gene expression was measured by log2Ratio. ATNSI, ATNSII, ATNSIII represented pistil of FMF when their BVD was 3.0–5.0, 5.1–13.0, and 13.1–25.0 mm. TNSI, TNSII, TNSIII represented pistil of BF when their BVD was 3.0–5.0, 5.1–13.0, and 13.1–25.0 mm. Different colors from blue to red showed the size of correlation coefficient. (B) Effects of different concentrations of ethylene on the ratio of BF. mg/L stands for the concentrations of ethylene. Control sprayed by water. Different small letters indicate significant difference between treatments at P < 0.05 by Duncan’s new multiple range test. Error bar represented standard deviation.
FIGURE 7
FIGURE 7
Relative quantity level of 9 selected genes at different stages of floral buds development in BF and FMF. Stage I, II, and III represents pistils of flower buds when their BVD were 3.0–5.0, 5.1–13.0, and 13.1–25.0 mm, blue column represents BF, red column represents FMF. Relative quantity levels were calculated by 2-ΔΔCT method with actin as a standard. Represents the level of significance difference P < 0.05, ∗∗ represents the level of significance difference P < 0.01 in independent-samples t-test.

References

    1. Alvarez-Buylla E. R., Liljegren S. J., Pelaz S. (2000). MADS-box gene evolution beyond flowers: expression in pollen, endosperm, guard cells, roots and trichomes. Plant J. 24 457–466. 10.1111/j.1365-313X.2000.00891.x - DOI - PubMed
    1. Baker S. C., Robinson-Beers K., Villanueva J. M., Gaiser J. C., Gasser C. S. (1997). Interactions among genes regulating ovule development in Arabidopsis thaliana. Genetics 145 1109–1124. - PMC - PubMed
    1. Balanzà V., Martínez-Fernández I., Ferrándiz C. (2014). Sequential action of FRUITFULL as a modulator of the activity of the floral regulators SVP and SOC1. J. Exp. Bot. 65 1193–1203. 10.1093/jxb/ert482 - DOI - PMC - PubMed
    1. Balasubramanian S., Schneitz K. (2002). NOZZLE links proximal-distal and adaxial-abaxial pattern formation during ovule development in Arabidopsis thaliana. Development 129 4291–4300. - PubMed
    1. Basu A., Penugonda K. (2008). Pomegranate juice: a heart healthy fruit juice. Nutr. Rev. 67 49–56. 10.1111/j.1753-4887.2008.00133.x - DOI - PubMed

LinkOut - more resources