. 2017 Aug 23;4(8):170183.
doi: 10.1098/rsos.170183. eCollection 2017 Aug.

Hovering hummingbird wing aerodynamics during the annual cycle. I. Complete wing

Affiliations

Hovering hummingbird wing aerodynamics during the annual cycle. I. Complete wing

Yonathan Achache et al. R Soc Open Sci. .

Abstract

The diverse hummingbird family (Trochilidae) has unique adaptations for nectarivory, among which is the ability to sustain hover-feeding. As hummingbirds mainly feed while hovering, it is crucial to maintain this ability throughout the annual cycle-especially during flight-feather moult, in which wing area is reduced. To quantify the aerodynamic characteristics and flow mechanisms of a hummingbird wing throughout the annual cycle, time-accurate aerodynamic loads and flow field measurements were correlated over a dynamically scaled wing model of Anna's hummingbird (Calypte anna). We present measurements recorded over a model of a complete wing to evaluate the baseline aerodynamic characteristics and flow mechanisms. We found that the vorticity concentration that had developed from the wing's leading-edge differs from the attached vorticity structure that was typically found over insects' wings; firstly, it is more elongated along the wing chord, and secondly, it encounters high levels of fluctuations rather than a steady vortex. Lift characteristics resemble those of insects; however, a 20% increase in the lift-to-torque ratio was obtained for the hummingbird wing model. Time-accurate aerodynamic loads were also used to evaluate the time-evolution of the specific power required from the flight muscles, and the overall wingbeat power requirements nicely matched previous studies.

Keywords: aerodynamics; animal flight; hovering; hummingbird; leading-edge vortex.


Conflict of interest statement

We declare we have no competing interests.

Figures
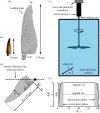
Figure 1.
Figure 1.
Top view of (a) C. anna’s dried wing and (b) a 3.5 : 1 wing model. (c) Schematic illustration of the experimental set-up. The angle of attack, α, is defined as the physical angle between the wing’s root chord and the horizontal plane. (d) Top view of the wing, depicting the coordinate system. (e) The wing motion kinematics, where θ˙ and θ¨ are the instantaneous angular velocity and acceleration, respectively. θ˙ is the angular velocity at mid-downstroke (θ=90°).
Figure 2.
Figure 2.
Top and side views of the experimental schemes that recorded the flow over the wing at α=30°: (a,b) stations along the span; (c,d) in the near-wake area behind the wing.
Figure 3.
Figure 3.
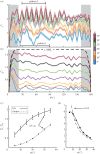
Time-accurate aerodynamic coefficients along the downstroke at all tested angles of attack: (a) lift (b) torque due to drag. Solid lines denote ensemble-averaged values; shaded regions represent the standard deviation (s.d.) value at each angular position. The dashed line in (b) represents the wing angular velocity profile along the downstroke. (c) Time-averaged aerodynamic coefficients at different angles of attack. Error bars represent the time-averaged standard deviation of measurements, magnified five times, for clarity. (d) Lift-to-torque ratio, compared to Polhamus leading-edge vortex geometric model of cotα [43], denoted by a dashed line.
Figure 4.
Figure 4.
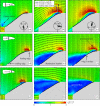
Flow field development at stages throughout the downstroke at α=30°. Rows are arranged by ascending span location: (ac) z=0.25, (df) z=0.5 and (gi) z=0.75. Columns are arranged by ascending angular position: θ=10° (a,d,g), θ=90° (b,e,h) and θ=170° (c,f,i). The colour scheme describes the in-plane velocity magnitude. Column (b,e,h) depicts the streamlines over the wing. The solid black line depicts the wing’s position, and the shaded grey area is the illumination shadow region behind it.
Figure 5.
Figure 5.
Near-wake flow fields measured at α=30°. Rows are arranged by ascending angular position: (ac) θ=22.5°; (df) θ=45°; (gi) θ=90°. Column (a,d,¡textit¿g¡/textit¿) depicts the near-wake flow field. The colour scheme denotes the ensemble averaged vertical velocity component, v; the flow fields standard deviation, σvw, is presented in column (b,e,h). Wing contour and the measured span stations are shown for reference; the flow fields at z=0.75 are presented in column (c,f,i); see figure 4 for panel descriptions.
Figure 6.
Figure 6.
Vorticity contours measured at α=30° over the wing depicting the spanwise vorticity concentration development at (a) θ=22.5°, (b) θ=90° and (c) θ=157.5°. A magnification of the tangential flow field in the vicinity of the leading-edge is presented for the distal span station (z=0.75) in (b), where the red line denotes the inflection points. (d) Net circulation; (e) positive and negative circulation. Circulation distribution along the span (scattered dots), corresponding to Ellington’s dynamic stall model [35] at (f) θ=10°, (g) θ=90° and (h) θ=170°. The model was scaled to produce the same integrated circulation along the span as the measured circulation.
Figure 7.
Figure 7.
Flow field standard deviation, σuv, at representative span stations and angular positions along the downstroke, measured at α=30°: (a) z=0.5, θ=45°; (b) z=0.5, θ=90°; (c) z=0.75, θ=45°; (d) z=0.75, θ=90°.
Figure 8.
Figure 8.
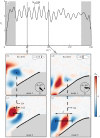
Modal inspection of the flow fields, measured at α=30°, and links to aerodynamic forces. (a) CL at α=30°. The spanwise vorticity fields of the two strongest modes (referenced to the highest vorticity value) at representative span stations and angular position along the downstroke: (b,c) z=0.75 and θ=45°; (d,e) z=0.5 and θ=90°. λ is the structure shedding wavelength.
Figure 9.
Figure 9.
Performance characteristics of C. anna’s wing. (a) PF¯ versus C¯L. The dashed line marks the time-averaged downstroke lift coefficient required to support the weight of a hovering hummingbird. (b) Time-accurate specific power throughout the downstroke. The specific power is interpolated to describe hovering conditions (dashed line). The shaded blue regions mark the uncertainties according to the variation of mb and h. The shaded red region represents the lower downstroke specific power muscle limitations [4].
Figure 10.
Figure 10.
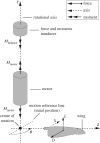
The schematic of the mechanical system. D is the drag force acting on the wing.

References

    1. Pearson OP. 1954. The daily energy requirements of a wild Anna hummingbird. Condor. 56, 317–322. (doi:10.2307/1365017) - DOI
    1. Epting RJ. 1980. Functional dependence of the power for hovering on wing disc loading in hummingbirds. Physiol. Zool. 53, 347–357. (doi:10.1086/physzool.53.4.30157873) - DOI
    1. Warrick D, Hedrick T, Fernández MJ, Tobalske B, Biewener A. 2012. Hummingbird flight. Curr. Biol. 22, R472–R477. (doi:10.1016/j.cub.2012.04.057) - DOI - PubMed
    1. Chai P, Millard D. 1997. Flight and size constraints: hovering performance of large hummingbirds under maximal loading. J. Exp. Biol. 200, 2757–2763. - PubMed
    1. Weis-Fogh T. 1972. Energetics of hovering flight in hummingbirds and in drosophila. J. Exp. Biol. 56, 79–104.