. 2017 Aug 30;4(8):170629.
doi: 10.1098/rsos.170629. eCollection 2017 Aug.

Diving behaviour of Cuvier's beaked whales exposed to two types of military sonar

Affiliations

Diving behaviour of Cuvier's beaked whales exposed to two types of military sonar

Erin A Falcone et al. R Soc Open Sci. .

Abstract

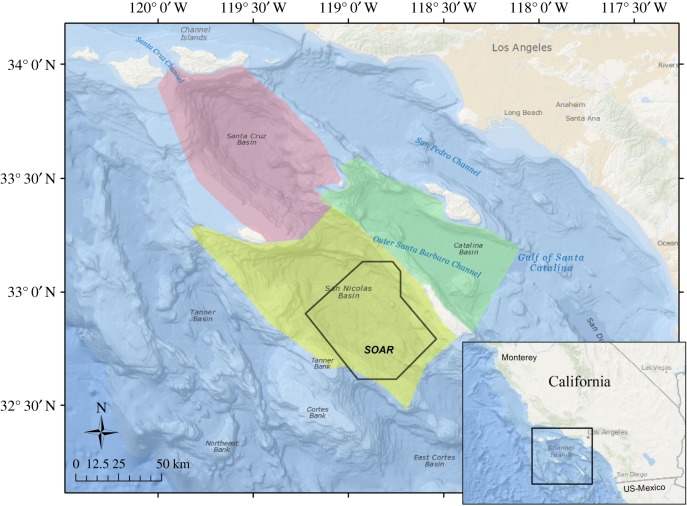
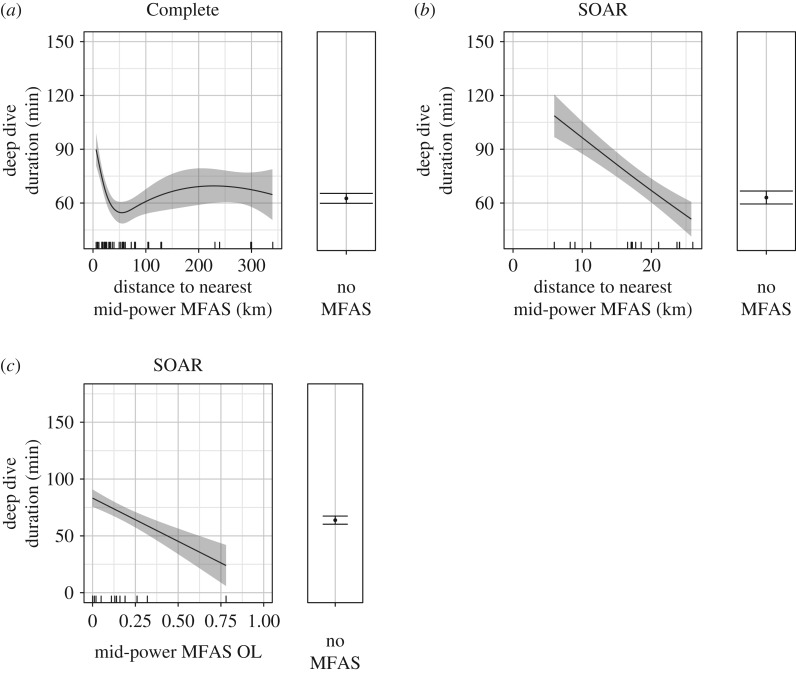
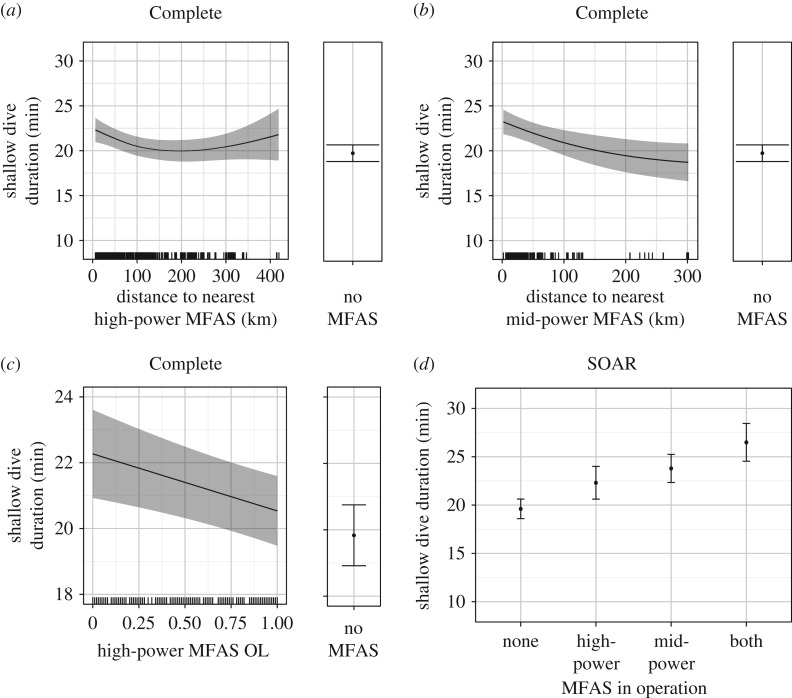
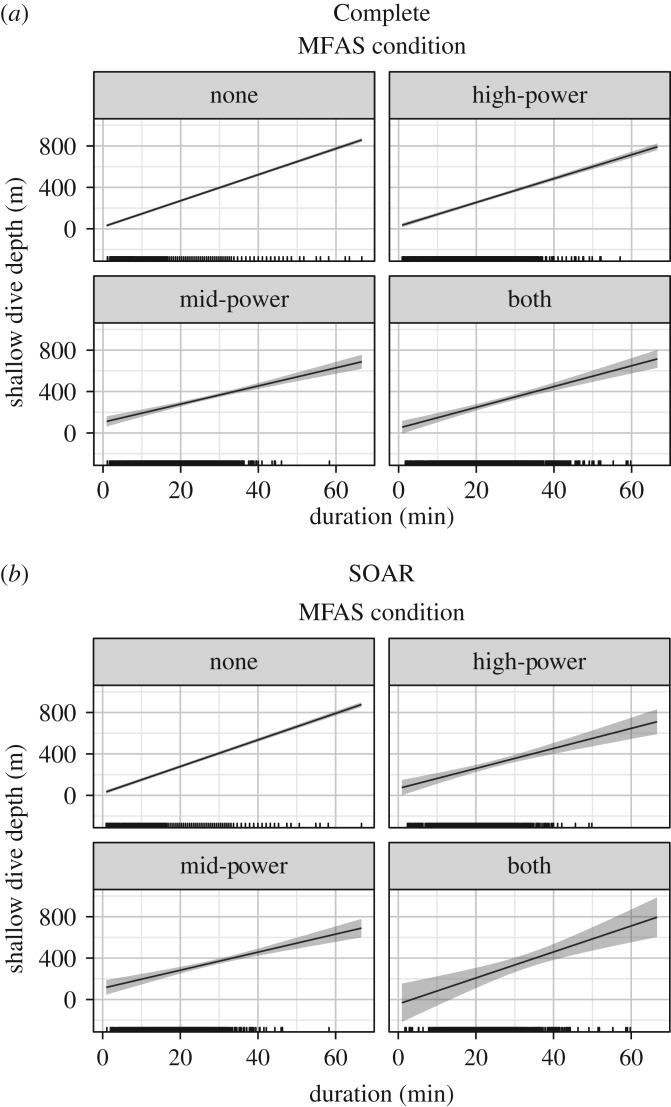
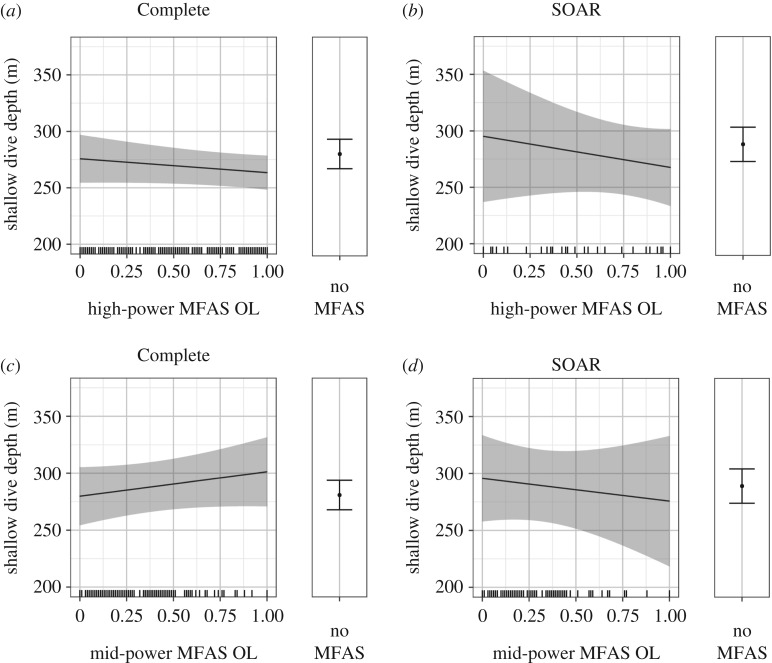
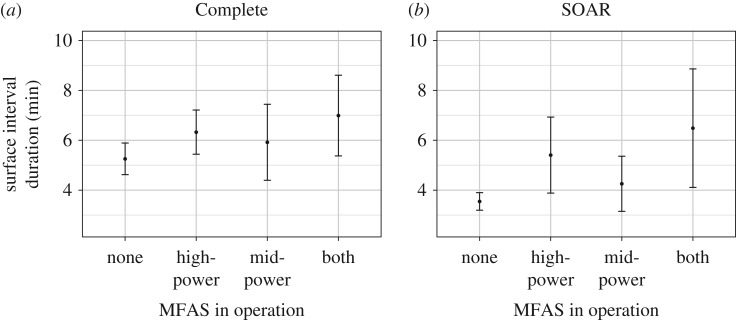
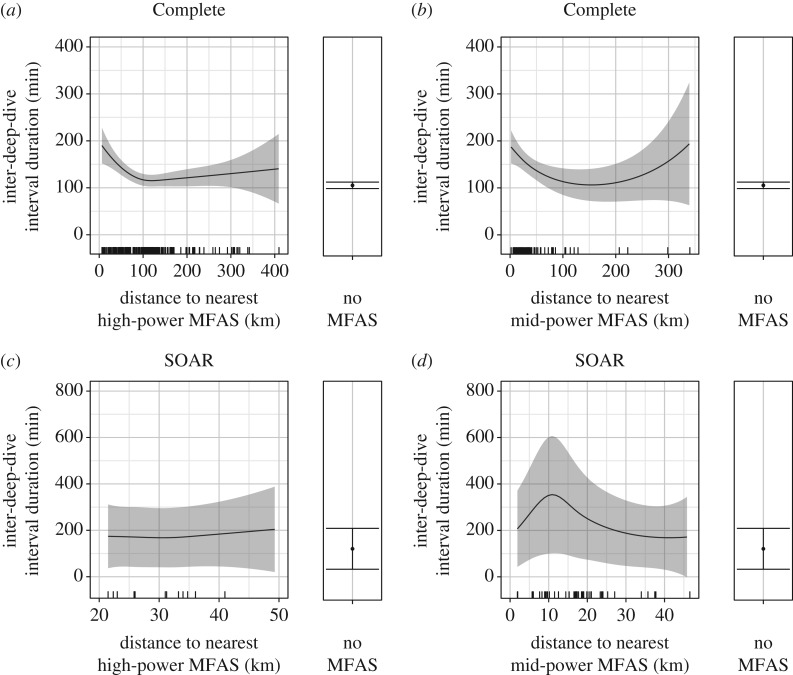
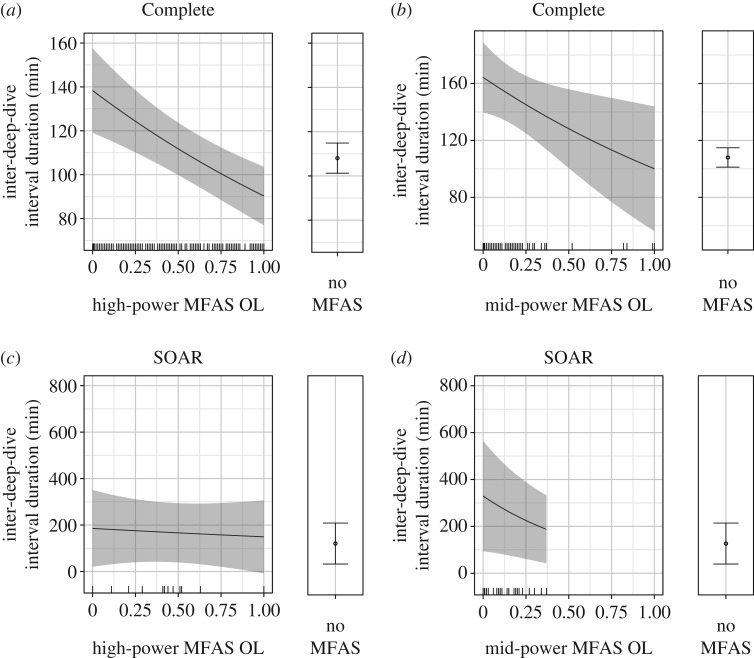
Cuvier's beaked whales (Ziphius cavirostris) have stranded in association with mid-frequency active sonar (MFAS) use, and though the causative mechanism linking these events remains unclear, it is believed to be behaviourally mediated. To determine whether MFAS use was associated with behavioural changes in this species, satellite tags were used to record the diving and movements of 16 Cuvier's beaked whales for up to 88 days in a region of frequent MFAS training off the coast of Southern California. Tag data were combined with summarized records of concurrent bouts of high-power, surface-ship and mid-power, helicopter-deployed MFAS use, along with other potential covariates, in generalized additive mixed-effects models. Deep dives, shallow dives and surface intervals tended to become longer during MFAS use, with some variation associated with the total amount of overlapping MFAS during the behaviour. These changes in dives and surface intervals contributed to a longer interval between deep dives, a proxy for foraging disruption in this species. Most responses intensified with proximity and were more pronounced during mid-power than high-power MFAS use at comparable distances within approximately 50 km, despite the significantly lower source level of mid-power MFAS. However, distance-mediated responses to high-power MFAS, and increased deep dive intervals during mid-power MFAS, were evident up to approximately 100 km away.

Keywords: California; Cuvier's beaked whale; behavioural response; sonar; tagging.


Conflict of interest statement

All authors have received additional funding for a follow-on effort to this study from the US Navy Living Marine Resources program. S.L.W., R.P.M. and D.J.M. are employees of the US Navy.

Figures

Figure 1.
Figure 1.
Map of study area with SOAR outlined in black and the geographical sub-areas used in analysis, corresponding to the three primary basins used by tagged whales, indicated by colour. Locations not within these basin boundaries were assigned to ‘Outside’. Inset map in the lower right corner shows a larger geographical area around the study site.
Figure 2.
Figure 2.
Predictions from the fitted models showing the effect of distance to the nearest mid-power MFAS on deep dive duration using the Complete (a) and SOAR (b) datasets, and effect of mid-power MFAS OL, or overlap (proportion of the dive during which MFAS was in use), on deep dive duration using SOAR data (c), with the predicted dive duration for MFAS-free periods at the right. Solid black lines/dots represent mean predicted values with shaded areas/error bars representing the 95% CI; hash marks along the X-axis indicate spread of data. The values of other model predictors were fixed as described in the Material and methods, including the following: dive depth = 1391.5 and mid-power OL = 0.15 (a); dive depth = 1519.5 and mid-power OL = 0.11 (b); dive depth = 1519.5 and mid-power distance = 17.24 (c).
Figure 3.
Figure 3.
Predictions from the fitted models showing the effect of distance to the nearest high-power (a) and mid-power (b) MFAS and high-power MFAS OL or overlap (proportion of the dive during which MFAS was in use) (c) on shallow dive duration in the Complete dataset, with the predicted duration for periods with no MFAS reported at right, and predictions of the constant effect of MFAS use on SOAR (d). Solid black lines/dots represent mean predicted values with shaded areas/error bars representing the 95% CI; hash marks along the X-axis indicate the spread of data. The values of other model predictors were fixed as described in the Material and methods, including the following: dive depth = 279.5 and high-power OL = 1 (a); dive depth = 279.5 and mid-power OL = 0.28 (b); dive depth = 279.5 and high-power distance = 98.01 (c); dive depth = 287.5, high-power OL = 1 and mid-power OL = 0.26 (d).
Figure 4.
Figure 4.
Predictions from the fitted models of shallow dive depth showing the change in the relationship between shallow dive depth and duration as a function of MFAS presence/absence, by type, in the Complete dataset (a) and on SOAR (b). The 95% CI for the relationship between depth and duration without MFAS (none) is so narrow that it is barely visible. Solid black lines represent mean predicted values with shaded areas representing the 95% CI; hash marks along the X-axis indicate the spread of data. The values of other model predictors were fixed as described in the Material and methods, including the following: high-power OL = 1 and mid-power OL = 0.28 (a); high-power OL = 1 and mid-power OL = 0.26 (b).
Figure 5.
Figure 5.
Predictions from the fitted models showing the effect of MFAS OL, or overlap (proportion of the dive during which MFAS was in use), on shallow dive depth as follows: high-power MFAS OL or overlap, in the Complete (a) and SOAR (b) datasets, mid-power MFAS OL in the Complete (c) and SOAR (d) datasets. In all plots, solid black lines/dots represent mean predicted values with shaded areas/error bars representing the 95% CI; hash marks along the X-axis indicate the spread of data. The values of other model predictors were fixed as described in the Material and methods, including the following: dive duration = 20.78 and high-power presence = 1 (a); dive duration = 20.83 and high-power presence = 1 (b); dive duration = 20.78 and mid-power presence = 1 (c); dive duration = 20.83 and mid-power presence = 1 (d).
Figure 6.
Figure 6.
Predictions from the fitted model showing the presence/absence effect of MFAS on surface interval duration in the Complete (a) and SOAR (b) datasets. Dots represent mean predicted values with error bars representing the 95% CI. For these plots, the values of other model predictors were fixed as described in the methods, including the following: Surface type = ‘Intermediate’.
Figure 7.
Figure 7.
Predictions from the fitted models showing the effect of distance to the nearest high-power (a) and mid-power (b) MFAS on the IDDI in the Complete dataset, and for high-power (c) and mid-power (d) using SOAR data, with the predicted IDDI for periods without MFAS at the right. Solid black lines/dots represent mean predicted values with shaded areas/error bars representing the 95% CI; hash marks along the X-axis indicate the spread of data. The values of other model predictors were fixed as described in the Material and methods, including the following: previous deep dive duration = 64.45 and high-power OL = 0.39 (a); previous deep dive duration = 64.45 and mid-power OL = 0.11 (b); previous deep dive duration = 64.51 and high-power OL = 0.46 (c); previous deep dive duration = 64.51 and mid-power OL = 0.10 (d).
Figure 8.
Figure 8.
Predictions from the fitted models of the effect of MFAS OL, or overlap (proportion of the interval during which MFAS was in use), on the IDDI: high-power OL (a) and mid-power OL (b) in the Complete dataset; high-power OL (c) and mid-power OL (d) on SOAR. Solid black lines/dots represent mean predicted values with shaded areas/error bars representing the 95% CI; hash marks along the X-axis indicate the spread of data. The values of other model predictors were fixed as described in the methods, including the following: previous deep dive duration = 64.45 and high-power distance = 98.23 (a); previous deep dive duration = 64.45 and mid-power distance = 27.29 (b); previous deep dive duration = 64.51 and high-power distance = 31.14 (c); previous deep dive duration = 64.51 and mid-power distance = 17.20 (d).

References

    1. Frantzis A. 1998. Does acoustic testing strand whales? Nature 392, 29 (doi:10.1038/32068) - DOI - PubMed
    1. Balcomb K III, Claridge D. 2001. A mass stranding of cetaceans caused by naval sonar in the Bahamas. Bahamas J. Sci. 8, 2–12.
    1. D'Amico A, Gisner RC, Ketten DR, Hammock JA, Johnson C, Tyack PL, Mead J. 2009. Beaked whale strandings and naval exercises. Aquat. Mamm. 34, 452–472. (doi:10.1578/AM.35.4.2009.452) - DOI
    1. Fernandez A, et al. 2004. Pathology: whales, sonar and decompression sickness (reply). Nature 428, U1 (doi:10.1038/nature02528a) - DOI - PubMed
    1. Jepson PD, et al. 2003. Gas-bubble lesions in stranded cetaceans. Nature 425, 575–576. (doi:10.1038/425575a) - DOI - PubMed