. 2017 Sep 7;18(9):1925.
doi: 10.3390/ijms18091925.

Event-Associated Oxygen Consumption Rate Increases ca. Five-Fold When Interictal Activity Transforms into Seizure-Like Events In Vitro

Affiliations

Event-Associated Oxygen Consumption Rate Increases ca. Five-Fold When Interictal Activity Transforms into Seizure-Like Events In Vitro

Karl Schoknecht et al. Int J Mol Sci. .

Abstract

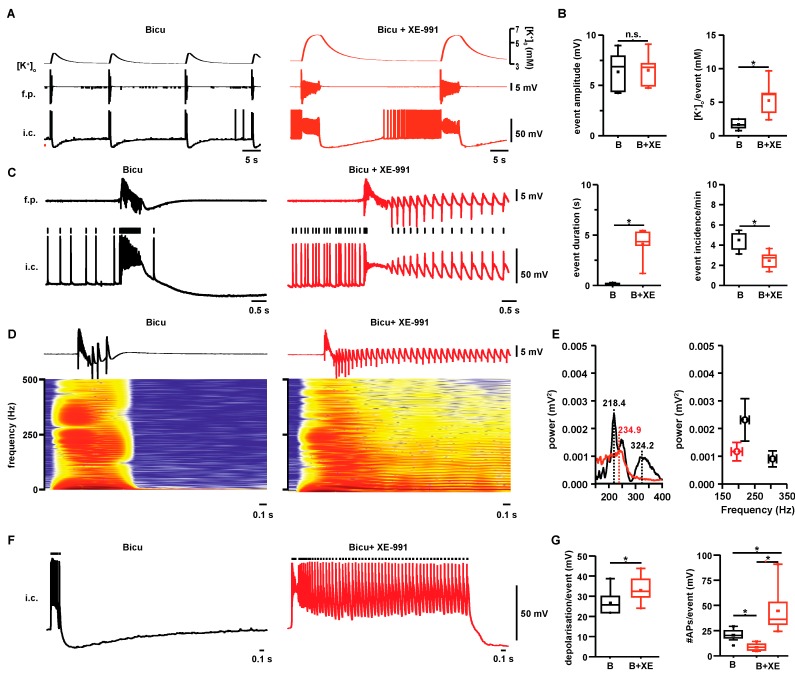
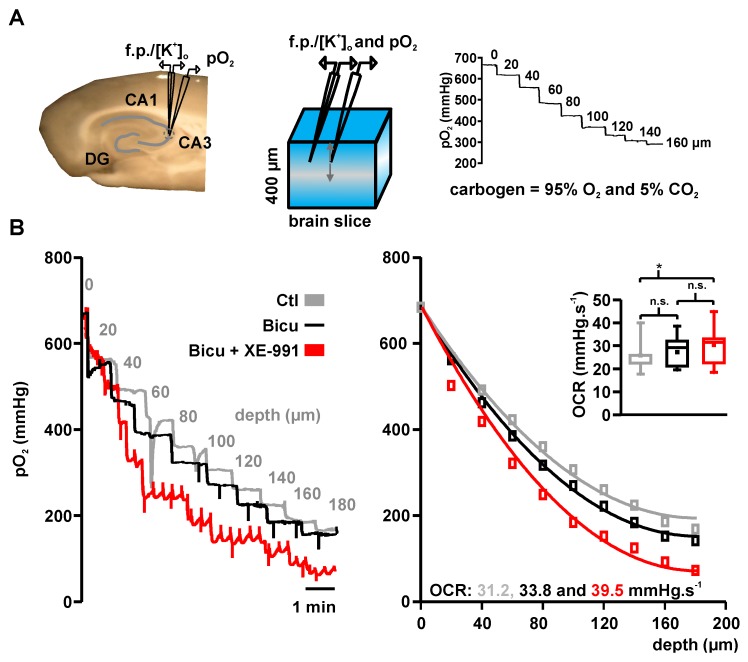
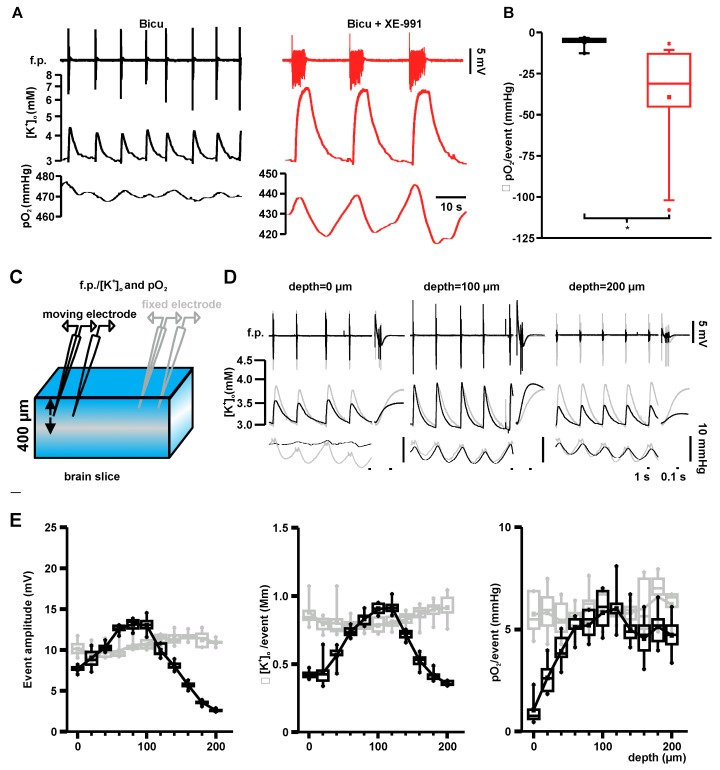
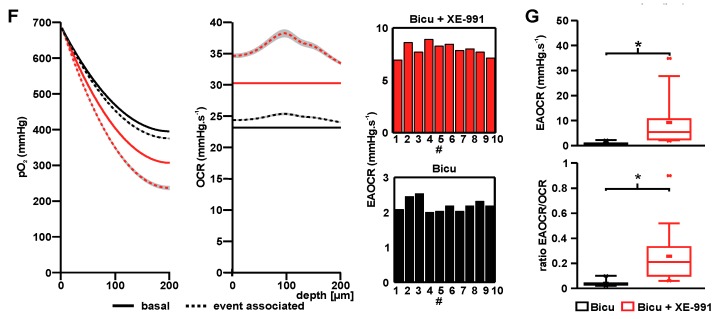
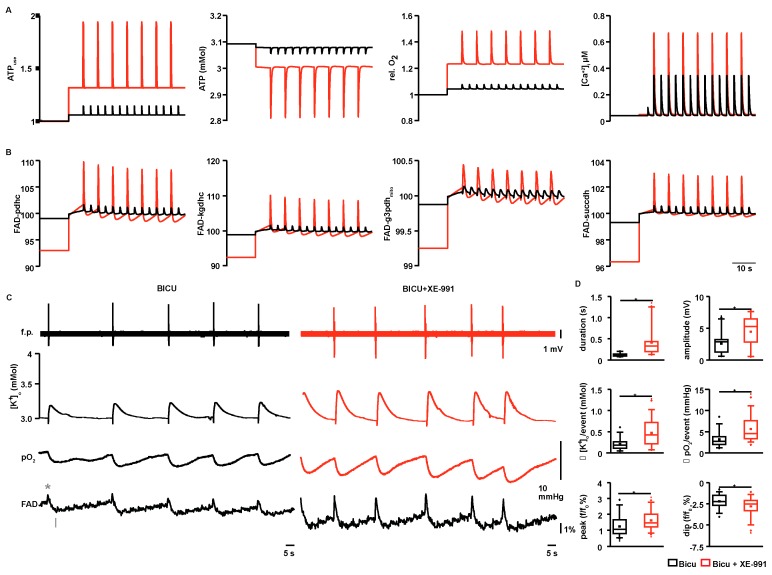
Neuronal injury due to seizures may result from a mismatch of energy demand and adenosine triphosphate (ATP) synthesis. However, ATP demand and oxygen consumption rates have not been accurately determined, yet, for different patterns of epileptic activity, such as interictal and ictal events. We studied interictal-like and seizure-like epileptiform activity induced by the GABAA antagonist bicuculline alone, and with co-application of the M-current blocker XE-991, in rat hippocampal slices. Metabolic changes were investigated based on recording partial oxygen pressure, extracellular potassium concentration, and intracellular flavine adenine dinucleotide (FAD) redox potential. Recorded data were used to calculate oxygen consumption and relative ATP consumption rates, cellular ATP depletion, and changes in FAD/FADH₂ ratio by applying a reactive-diffusion and a two compartment metabolic model. Oxygen-consumption rates were ca. five times higher during seizure activity than interictal activity. Additionally, ATP consumption was higher during seizure activity (~94% above control) than interictal activity (~15% above control). Modeling of FAD transients based on partial pressure of oxygen recordings confirmed increased energy demand during both seizure and interictal activity and predicted actual FAD autofluorescence recordings, thereby validating the model. Quantifying metabolic alterations during epileptiform activity has translational relevance as it may help to understand the contribution of energy supply and demand mismatches to seizure-induced injury.

Keywords: ATP; epilepsy; oxygen.


Conflict of interest statement

The authors declare no conflict of interest.

Figures

Figure 1
Figure 1
Properties of ILEs and SLEs: (A) Simultaneous recording of field potential (f.p.), extracellular potassium concentration ([K+]o) and intracellular recording from CA3 pyramids (i.c., bottom traces) during interictal-like events (ILEs) induced by bicuculline (black) and seizure-like events (SLEs) induced by the co-application of bicuculline and XE-991 (red); (B) ILEs and SLEs differed significantly in event-associated [K+]o-rises, event duration and incidence, while event amplitudes remained unaltered (* p < 0.05, n = 6, paired t-test); (C) Detail of typical f.p. recording and i.c. correlate during ILEs and SLEs. Bicuculline-induced ILEs are short paroxysmal discharges characterized by a slow wave with superimposed high-frequency oscillations (HFOs). The simultaneous i.c., recording shows a typical depolarization with cell firing. SLEs are characterized by an initial ILE followed by repetitive brief bursts. Compared with ILEs, cell firing is reduced during the first component (slow wave) of the discharge with concomitantly increased cell firing during the after discharges; (D) and (E) Fast Fourier transform (FFT)-based frequency sonograms of exemplary ILE and SLE. During bicuculline-induced ILE, HFOs typically displayed two main peaks (see corresponding power spectrum in E, black line). During SLEs, the faster oscillatory peak was abolished (red line). Right: Averaged main frequency and power of HFOs during ILEs (black) and SLEs (red) (n = 6); (F) I.c. recording during ILEs (black trace) and SLEs (red trace): bicuculline bursts are marked membrane depolarizations with high frequency action potential (AP)-firing (small black line on top). SLEs also begin with a pronounced membrane depolarization, however, with less firing, followed by repeated cell bursting; and (G) Compared with ILEs (black), SLEs (red) were associated with increased membrane depolarization amplitudes (left). The number of APs decreased significantly during the initial burst under SLEs (red box, middle) compared with ILEs. When the total number of APs during the whole discharge was measured (red box on the right), SLEs were associated with a marked increase in neuronal firing compared with ILEs. (* p < 0.05, n = 11 cells from six slices, paired t-test).
Figure 2
Figure 2
Variations in basal pO2 under bicuculline and bicuculline + XE-991: (A) Left: Picture and scheme of typical electrode placement in acute hippocampal slice. Double-barreled ion-sensitive microelectrodes (with field potential and ion-sensitive recording side) and Clark-style oxygen electrodes were placed ~80 µm below the slice surface in the pyramidal layer of area CA3. Acute brain slices receive oxygen from surface and bottom and the partial oxygen pressure (pO2) decreases with the distance to the source of oxygen (i.e., distance to the slice bottom and surface) providing typical depth profiles (see right, numbers in trace—distance to slice surface). The oxygen gradient along the slice depends on oxygen supply and solubility, which are both constant under experimental conditions. Hence, changes in pO2 depth profiles reflect activity-dependent O2 consumption; and (B) Using an established reaction-diffusion model, peak pO2-levels at each vertical step in the pO2 profile (left) were fitted (right) to calculate oxygen consumption rates (OCR). OCRs increased from control (spontaneous activity, gray, 31.2 mmHg·s−1) to induced ILEs (black, 33.8 mmHg·s−1) and SLEs (red, 39.5 mmHg·s−1) in this example. The quantitative analysis (inset) revealed a significant OCR increase during SLEs (red) compared with control conditions (gray, * p = 0.008, n.s. not significant, n = 8, paired t-test with Bonferroni post-hoc correction).
Figure 3
Figure 3
Locality of activity and modeling of local oxygen consumption rates associated with ILEs and SLEs in brain slices: (A) Typical f.p., extracellular potassium ([K+]o) and oxygen recordings of ILEs (black) and SLEs (red). Event-associated oxygen baseline drops were larger in SLEs compared with ILEs; (B) Local oxygen drops during ILEs and SLEs at 80 µm from the slice surface. Event-related pO2 drops during SLEs (red) were significantly larger compared with ILEs (black) (p = 0.011, n = 8 and 15 for ILEs and SLEs respectively, independent t-test); (C) Scheme of brain slice recordings under interface conditions with two pairs of double-barreled potassium-sensitive microelectrodes and Clark-style oxygen electrodes. One pair of electrodes was moved in vertical steps through the pyramidal layer in area CA3 (moving electrode). A second stationary pair of electrodes was placed in close vicinity at ~80 µm below the slice surface (fixed electrode) to control for signal stability; (D) Overlay of the recording signals from the two pairs of electrodes (black: moving electrode, grey: fixed electrode) during bicuculline-induced ILEs. F.p., [K+]o and oxygen drops remained stable at the fixed electrode, while f.p. amplitudes and [K+]o peaks were larger at 100 µm compared with 0 and 200 µm at the moving electrode. Oxygen dips increased from 0 to 100 µm and remained large at a depth of 200 µm in the moving electrode; (E) ILE-associated amplitudes, event-related peak potassium levels and pO2-drops at different depths along the slice. Field potential and potassium levels showed a very similar amplitude distribution with a peak around 100 µm. Oxygen drops were smaller near the surface, but remained stable after 60–80 µm (gray—fixed electrode, black—moving electrode); (F) Fitted basal pO2-depth profiles (left, solid line) and event-associated depth profiles (left, dashed line) for bicuculline (black) and bicuculline + XE-991 (red). Basal OCRs (solid line, right graph) and depth-dependent event-associated OCRs (EAOCR, dotted line, right graph, EAOCR = OCR/event (mmHg·s−1)). Bar plots show EAOCRs for ten individual events; and (G) EAOCR (top) and ratio of EAOCR to basal OCR (bottom) during ILEs and SLEs. During SLEs (red) EAOCRs were significantly higher compared with EAOCRs during ILEs (black; p = 0.016, n = 8 and 15 for ILEs and SLEs; independent t-test). The ratio comparing EAOCRs to the basal OCR was significantly higher under SLEs compared with ILEs (p = 0.035, n = 8 and 15 for ILEs and SLEs, respectively, independent t-test).
Figure 3
Figure 3
Locality of activity and modeling of local oxygen consumption rates associated with ILEs and SLEs in brain slices: (A) Typical f.p., extracellular potassium ([K+]o) and oxygen recordings of ILEs (black) and SLEs (red). Event-associated oxygen baseline drops were larger in SLEs compared with ILEs; (B) Local oxygen drops during ILEs and SLEs at 80 µm from the slice surface. Event-related pO2 drops during SLEs (red) were significantly larger compared with ILEs (black) (p = 0.011, n = 8 and 15 for ILEs and SLEs respectively, independent t-test); (C) Scheme of brain slice recordings under interface conditions with two pairs of double-barreled potassium-sensitive microelectrodes and Clark-style oxygen electrodes. One pair of electrodes was moved in vertical steps through the pyramidal layer in area CA3 (moving electrode). A second stationary pair of electrodes was placed in close vicinity at ~80 µm below the slice surface (fixed electrode) to control for signal stability; (D) Overlay of the recording signals from the two pairs of electrodes (black: moving electrode, grey: fixed electrode) during bicuculline-induced ILEs. F.p., [K+]o and oxygen drops remained stable at the fixed electrode, while f.p. amplitudes and [K+]o peaks were larger at 100 µm compared with 0 and 200 µm at the moving electrode. Oxygen dips increased from 0 to 100 µm and remained large at a depth of 200 µm in the moving electrode; (E) ILE-associated amplitudes, event-related peak potassium levels and pO2-drops at different depths along the slice. Field potential and potassium levels showed a very similar amplitude distribution with a peak around 100 µm. Oxygen drops were smaller near the surface, but remained stable after 60–80 µm (gray—fixed electrode, black—moving electrode); (F) Fitted basal pO2-depth profiles (left, solid line) and event-associated depth profiles (left, dashed line) for bicuculline (black) and bicuculline + XE-991 (red). Basal OCRs (solid line, right graph) and depth-dependent event-associated OCRs (EAOCR, dotted line, right graph, EAOCR = OCR/event (mmHg·s−1)). Bar plots show EAOCRs for ten individual events; and (G) EAOCR (top) and ratio of EAOCR to basal OCR (bottom) during ILEs and SLEs. During SLEs (red) EAOCRs were significantly higher compared with EAOCRs during ILEs (black; p = 0.016, n = 8 and 15 for ILEs and SLEs; independent t-test). The ratio comparing EAOCRs to the basal OCR was significantly higher under SLEs compared with ILEs (p = 0.035, n = 8 and 15 for ILEs and SLEs, respectively, independent t-test).
Figure 4
Figure 4
Modeling of basal and event-associated ATP consumption rates, ATP levels and FAD reduction states associated with ILEs and SLEs: (A) Basal ATP consumption increased by 6% and 32% compared with control during bicuculline (black) and bicuculline + XE-991 (red) application, which decreased cellular ATP levels to 3.08 mM and 3.0 mM. Event associated ATP consumption was higher under SLEs (~94% above control) compared with ILEs (~15% above control) and associated with a decrease in cellular ATP level to 3.05 mM and 2.81 mM. The third plot summarizes the relative changes in basal OCR and EAOCR (see also Figure 2B and Figure 3G). Intracellular Ca2+ transients are shown on the right; (B) FAD reduction states for FAD bound to pyruvate dehydrogenase complex (pdhc), α-ketogluterate dehydrogenase complex (kgdhc), mitochondrial glycerol-3-phosphate dehydrogenase (g3pdhmito), and succinate dehydrogenase (succdh). Single events elicit increased FAD oxidation in all enzymes, with a higher peak value for SLEs compared with ILEs. In order to emphasize changes in event-associated FAD redox states, ILEs and SLEs were aligned, by manually shifting the baseline; (C) Simultaneous f.p., [K+]o, pO2 and FAD-autofluorescence recording during ILEs (black) and SLEs (red). Under submerged conditions event amplitudes were smaller, yet morphologically similar to interface conditions (Figure 1 and Figure 2). Event duration, [K+]o peaks and local pO2 drops increased during SLEs compared with ILEs. Simultaneously recorded FAD-transients showed increased oxidation, which was predicted by the model. Importantly, the data used for modeling was based on recordings under interface conditions; and (D) Quantification for C. Similar to interface conditions, SLEs showed significantly increased event durations, [K+]o-rises and local oxygen drops (top and middle). In contrast with interface conditions, f.p. event amplitudes increased from ILEs to SLEs (top). As predicted by the computational model, event-related FAD-transients, i.e., FAD peaks (see asterisk in C) and dips (see arrow in C), were significantly enhanced (bottom). * p < 0.05, n = 90 individual ILEs and 114 SLEs, independent t-test.

References

    1. Erecińska M., Silver I.A. Tissue oxygen tension and brain sensitivity to hypoxia. Respir. Physiol. 2001;128:263–276. doi: 10.1016/S0034-5687(01)00306-1. - DOI - PubMed
    1. Heinemann U., Buchheim K., Gabriel S., Kann O., Kovacs R. Coupling of electrical and metabolic activity during epileptiform discharges. Epilepsia. 2002;43(Suppl. S5):168–173. doi: 10.1046/j.1528-1157.43.s.5.15.x. - DOI - PubMed
    1. Ames A. CNS energy metabolism as related to function. Brain Res. Rev. 2000;34:42–68. doi: 10.1016/S0165-0173(00)00038-2. - DOI - PubMed
    1. Fisher R.S., Scharfman H.E., deCurtis M. How Can We Identify Ictal and Interictal Abnormal Activity? Springer; Berlin, Germany: 2014. pp. 3–23. - PMC - PubMed
    1. Fernández-Klett F., Offenhauser N., Dirnagl U., Priller J. Pericytes in capillaries are contractile in vivo, but arterioles mediate functional hyperemia in the mouse brain. Proc. Natl. Acad. Sci. USA. 2010;107:22290–22295. doi: 10.1073/pnas.1011321108. - DOI - PMC - PubMed

LinkOut - more resources