Quality specification and status of internal quality control of cardiac biomarkers in China from 2011 to 2016
- PMID: 28881400
- PMCID: PMC6817044
- DOI: 10.1002/jcla.22324
Quality specification and status of internal quality control of cardiac biomarkers in China from 2011 to 2016
Abstract
Background: This study aimed to investigate the status of internal quality control (IQC) for cardiac biomarkers from 2011 to 2016 so that we can have overall knowledge of the precision level of measurements in China and set appropriate precision specifications.
Methods: Internal quality control data of cardiac biomarkers, including creatinine kinase MB (CK-MB) (μg/L), CK-MB(U/L), myoglobin (Mb), cardiac troponin I (cTnI), cardiac troponin T (cTnT), and homocysteines (HCY), were collected by a web-based external quality assessment (EQA) system. Percentages of laboratories meeting five precision quality specifications for current coefficient of variations (CVs) were calculated. Then, appropriate precision specifications were chosen for these six analytes. Finally, the CVs and IQC practice were further analyzed with different grouping methods.
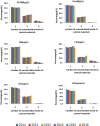
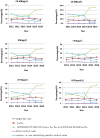
Results: The current CVs remained nearly constant for 6 years. cTnT had the highest pass rates every year against five specifications, whereas HCY had the lowest pass rates. Overall, most analytes had a satisfactory performance (pass rates >80%), except for HCY, if one-third TEa or the minimum specification were employed. When the optimal specification was applied, the performance of most analytes was frustrating (pass rates < 60%) except for cTnT. The appropriate precision specifications of Mb, cTnI, cTnT and HCY were set as current CVs less than 9.20%, 9.90%, 7.50%, 10.54%, 7.63%, and 6.67%, respectively. The data of IQC practices indicated wide variation and substantial progress.
Conclusion: The precision performance of cTnT was already satisfying, while the other five analytes, especially HCY, were still frustrating; thus, ongoing investigation and continuous improvement for IQC are still needed.
Keywords: analytical phase; biochemical markers; health care; quality control; quality indicators; quality specification.
© 2017 Wiley Periodicals, Inc.
Figures


References
-
- WHO . The world health report 2003 ‐ shaping the future. Times of India. 2004.
-
- Thygesen K, Alpert JS, Jaffe AS, Simoons ML, Chaitman BR, White HD. Third universal definition of myocardial infarction. Circulation. 2012;126:2020‐2035. - PubMed
MeSH terms
Substances
LinkOut - more resources
Full Text Sources
Other Literature Sources
Research Materials
Miscellaneous

