. 2017 Jan 31;8(31):50731-50746.
doi: 10.18632/oncotarget.14913. eCollection 2017 Aug 1.

Macrophages promote the progression of premalignant mammary lesions to invasive cancer

Affiliations

Macrophages promote the progression of premalignant mammary lesions to invasive cancer

Emily C Carron et al. Oncotarget. .

Abstract

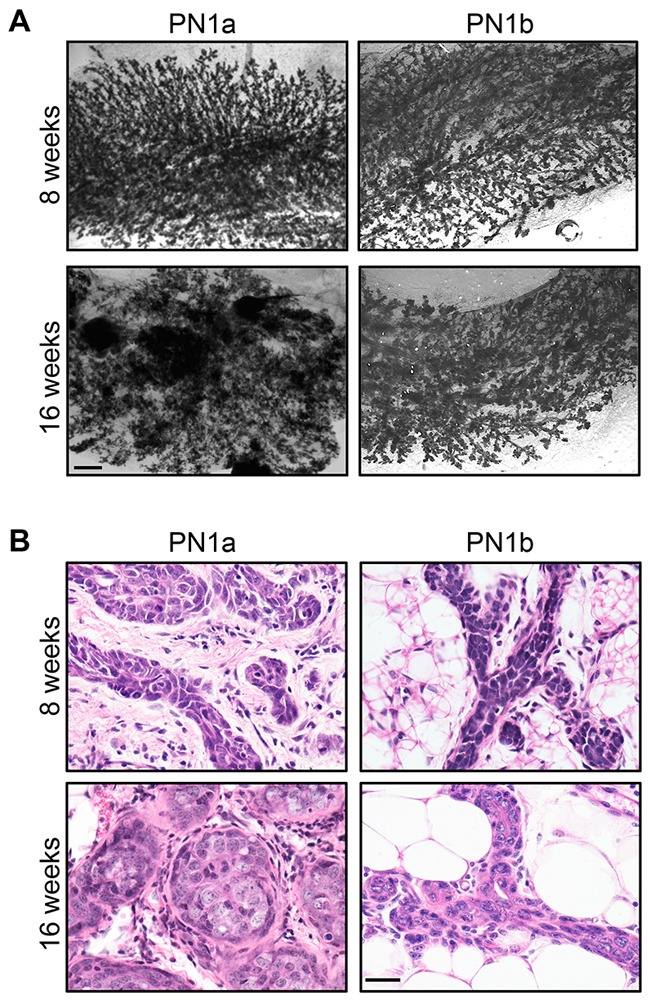
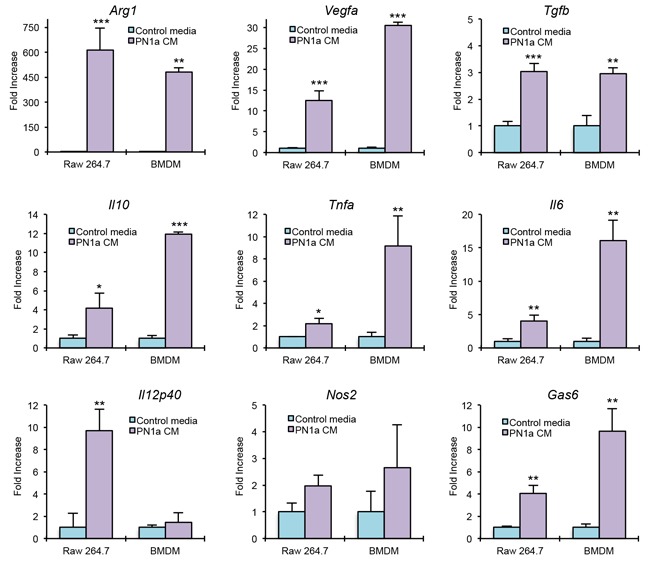
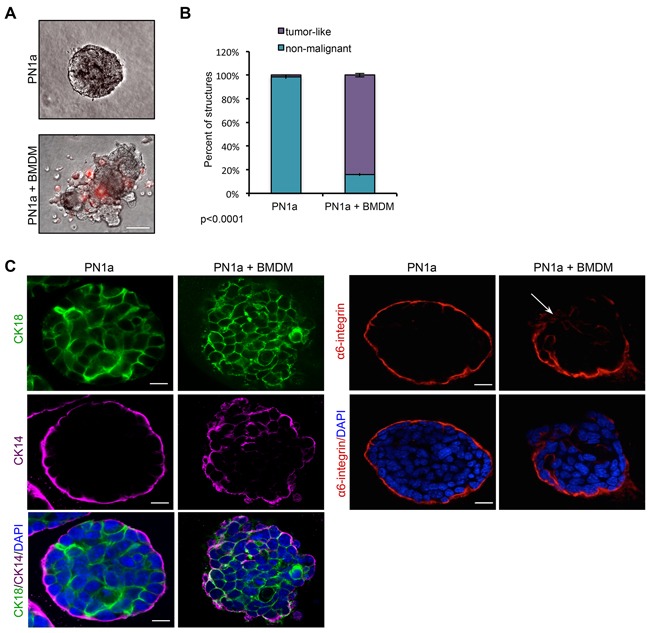
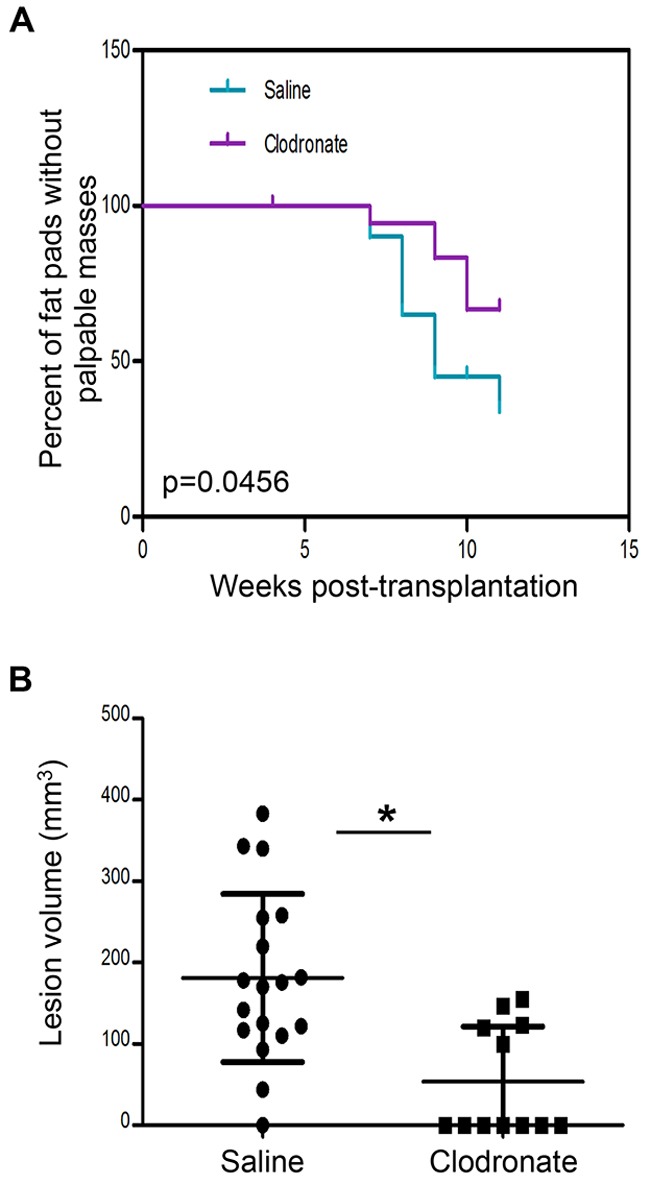
Breast cancer initiation, progression and metastasis rely on a complex interplay between tumor cells and their surrounding microenvironment. Infiltrating immune cells, including macrophages, promote mammary tumor progression and metastasis; however, less is known about the role of macrophages in early stage lesions. In this study, we utilized a transplantable p53-null model of early progression to characterize the immune cell components of early stage lesions. We show that macrophages are recruited to ductal hyperplasias with a high tumor-forming potential where they are differentiated and polarized toward a tumor-promoting phenotype. These macrophages are a unique subset of macrophages, characterized by pro-inflammatory, anti-inflammatory and immunosuppressive factors. Macrophage ablation studies showed that macrophages are required for both early stage progression and primary tumor formation. These studies suggest that therapeutic targeting of tumor-promoting macrophages may not only be an effective strategy to block tumor progression and metastasis, but may also have critical implications for breast cancer prevention.

Keywords: breast cancer progression; early stage lesion; inflammation; macrophage; mammary.


Conflict of interest statement

CONFLICTS OF INTEREST The authors declare no conflicts of interest.

Figures

Figure 1
Figure 1. PN1a lesions progress to invasive cancer
PN tissue was transplanted into the cleared fat pads of 3 week old Balb/c mice and allowed to grow for 8 or 16 weeks. A. Representative whole mount preparations of carmine alum stained mammary glands. Scale bar = 2 mm. B. Representative 60X images of H&E staining of PN1a and PN1b lesions at 8 or 16 weeks post-transplantation. Scale bar = 5 μm.
Figure 2
Figure 2. PN1a lesions have increased infiltrating macrophages as compared to PN1b lessions
A. Heat map depicting gene expression patterns that are altered in PN1a and PN1b lesions at 8 weeks post-transplantation. B. Heat map depicting selected immune cell-associated genes that were significantly changed in PN1a lesions as compared to PN1b and p53-/- lesions. C. Graphical representation of gene ontology terms significantly increased in PN1a as compared to PN1b lesions. P-values were determined by a one-sided Fisher's exact test. D. Top: Graph shows quantitation of the average number of F4/80+ cells per field of view (FOV) in p53-/- glands, PN1a and PN1b. For each lesion, a minimum of 5 FOV were captured under 40X and F4/80+ cells were counted from 4 lesions (4 mice) for each group. Bottom: Representative 60X images of F4/80 staining in PN1a and PN1b lesions at 8 weeks post-transplantation, and p53-/- mammary glands 8 weeks of age. A no primary antibody control from normal wildtype mammary glands is depicted. Scale bar = 20 μm. *p<0.05.
Figure 3
Figure 3. Macrophage populations in early stage PN1a lesions express a mixture of pro- and anti-tumorigenic markers
Cells were isolated from PN1a lesions at different stages of progression and analyzed by flow cytometry. For all dot plots, live cells were selected by gating on SYTOX red- cells, and epithelial cells were excluded by gating on CD45+ cells. A. Dot plots show the numbers of F4/80+CD11b+ macrophages at different stages of PN1a progression. For B-D, CD11b+ subpopulations were first selected and further analyzed for the expression of B. CD206 and F4/80, C. CD204 and F4/80 and D. MHCII and F4/80. A minimum of 3 lesions (3 mice) were analyzed for each time point.
Figure 4
Figure 4. PN1a cells polarize macrophages to a tumor-promoting phenotype
BMDMs and RAW 264.7 cells were cultured in the presence of PN1a conditioned media (CM) or control media. After 2 hours, cells were collected and qPCR was performed using primers to Arg1, Il10, Vegfa, Tgfb, Gas6, Il12p40, Nos2, Il6, and Tnfa. Values were normalized to GAPDH or 18S. Values shown are mean and SD (n=3) from one representative experiment. *p<0.05, **p<0.01,***p<0.001.
Figure 5
Figure 5. Macrophages induce a malignant phenotype in PN1a cells grown in 3D culture
PN1a cells were co-cultured with BMDMs on Matrigel for 10 days. A. Representative phase-contrast images of PN1a acini alone (top) or after 10 days of co-culture with PKH26-labelled BMDMs (red) (bottom). Scale bar = 50 μm. B. Quantification of the number of tumor-like or non-malignant acini. Approximately 30 acini per group were examined for each experiment from 3 independent experiments. Error bars represent SD, and p-value was determined using a 2×2 contingency table and Chi-squared analysis (p<0.0001). C. (Left) Representative confocal images of acini immunostained with antibodies against CK-18 (green), CK-14 (purple), and nuclei were counterstained with DAPI (blue). Scale bar = 25 μm. (Right) Representative confocal images of structures immunostained with antibodies against α6-integrin (red), and nuclei were counterstained with DAPI (blue). Scale bars = 25 μm.
Figure 6
Figure 6. Macrophage depletion using clodronate liposomes impairs the progression of PN1a lesions
A. Dot plot depicts that the number of CD45+CD11b+F4/80+ cells is decreased in PN1a lesions in clodronate liposome-treated mice as compared to saline-treated. B. H&E analysis and quantification of histological grade of saline- and clodronate liposome-treated lesions. Values shown are the number of lesions classified for each histological grade, and a one-way ANOVA with Tukey post-hoc test was used to determine significant differences in grade (p< 0.05). C-E. Representative images of immunostaining of early stage PN1a lesions from saline- or clodronate-treated mice using antibodies to C. pan-cytokeratin (PanCK, green) and laminin (red), showing intact or fragmented (white arrow) basement membranes, D. PanCK (green) and Ki67 (red), E. CK8 (green) and CK14 (red). F. Quantification of the integrity of the basement membrane as defined by intact, fragmented or negative. A minimum of 5 FOVs were counted for each lesion, and a minimum of 10 lesions (6 mice) were analyzed for each treatment group (n=10). G. Graph depicts the percentage of Ki67+ proliferating cells, calculated by counting total epithelial cell number by co-staining with PanCK. A minimum of 6 FOVs were counted per each lesion, and a minimum of 6 mice (9 lesions) were counted for each treatment group. H. Quantification of CK8 and CK14 staining. Ten FOV were counted for each lesion and a minimum of 10 lesions (6 mice) were counted for each group. Values are shown as the mean + SD. *p<0.05, **p<0.01, ***p<0.001. Scale bars = 20 μm.
Figure 7
Figure 7. Macrophage depletion using clodronate liposomes impairs PN1a tumor formation in vivo
PN1a-bearing mice were administered clodronate liposomes (or saline control) every 3 days for 9 weeks (11 weeks post-transplantation), to allow for palpable tumor formation. A. Kaplan-Meier curve showing the number of fat pads with palpable masses at 0-11 weeks post-transplantation. The log rank test was used for statistical analysis (p=0.0456), and 20 lesions (10 mice) were included for each group. B. Scatter plots show quantification of tumor volume (mm3) at 11 weeks post-transplantation for saline-treated (18 lesions/tumors, 10 mice) or clodronate liposome-treated (12 lesions/tumors, 11 mice) *p<0.05.

References

    1. Laoui D, Movahedi K, Van Overmeire E, Van den Bossche J, Schouppe E, Mommer C, Nikolaou A, Morias Y, De Baetselier P, Van Ginderachter JA. Tumor-associated macrophages in breast cancer: distinct subsets, distinct functions. Int J Dev Biol. 2011;55:861–7. doi: 10.1387/ijdb.113371dl. - DOI - PubMed
    1. Qian BZ, Pollard JW. Macrophage diversity enhances tumor progression and metastasis. Cell. 2010;141:39–51. doi: 10.1016/j.cell.2010.03.014. - DOI - PMC - PubMed
    1. DeNardo DG, Brennan DJ, Rexhepaj E, Ruffell B, Shiao SL, Madden SF, Gallagher WM, Wadhwani N, Keil SD, Junaid SA, Rugo HS, Hwang ES, Jirstrom K, et al. Leukocyte complexity predicts breast cancer survival and functionally regulates response to chemotherapy. Cancer Discov. 2011;1:54–67. doi: 10.1158/2159-8274.CD-10-0028. - DOI - PMC - PubMed
    1. Sainz B, Jr, Carron E, Vallespinos M, Machado HL. Cancer stem cells and macrophages: implications in tumor biology and therapeutic strategies. Mediators Inflamm. 2016;2016:9012369. doi: 10.1155/2016/9012369. - DOI - PMC - PubMed
    1. Chen J, Yao Y, Gong C, Yu F, Su S, Chen J, Liu B, Deng H, Wang F, Lin L, Yao H, Su F, Anderson KS, et al. CCL18 from tumor-associated macrophages promotes breast cancer metastasis via PITPNM3. Cancer Cell. 2011;19:541–55. doi: 10.1016/j.ccr.2011.02.006. - DOI - PMC - PubMed