

Altered erythropoiesis and decreased number of erythrocytes in children with neuroblastoma
- PMID: 28881804
- PMCID: PMC5581103
- DOI: 10.18632/oncotarget.18285
Altered erythropoiesis and decreased number of erythrocytes in children with neuroblastoma
Abstract
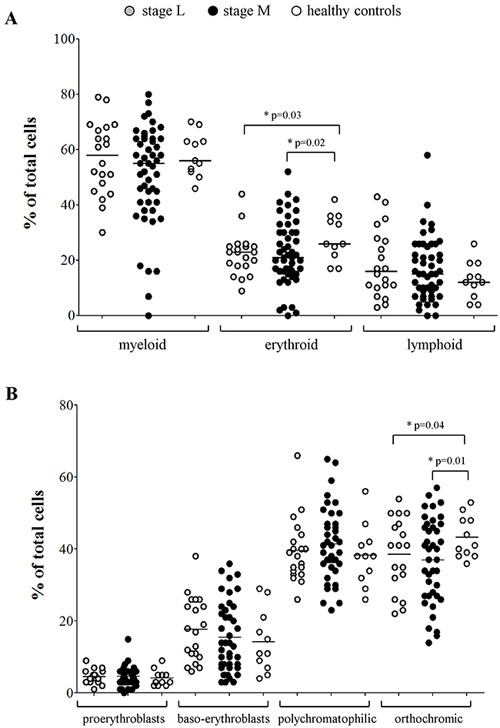
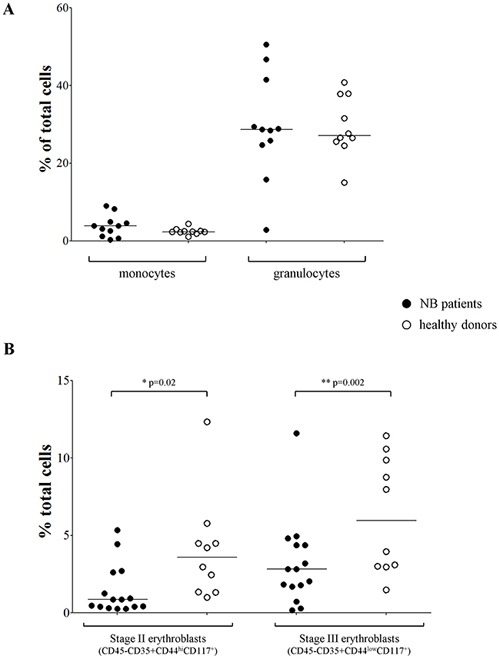
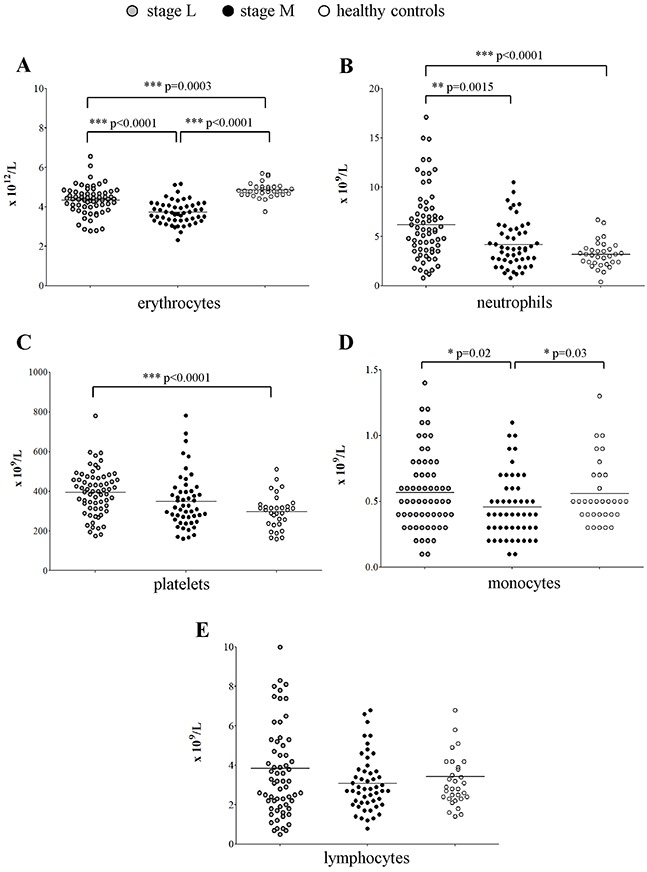
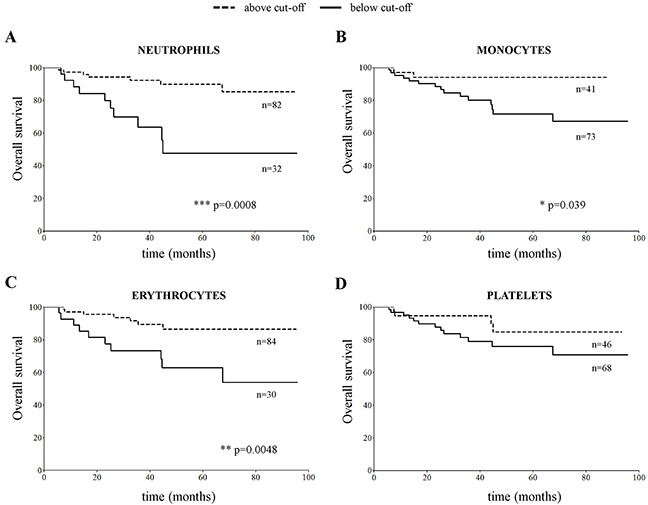
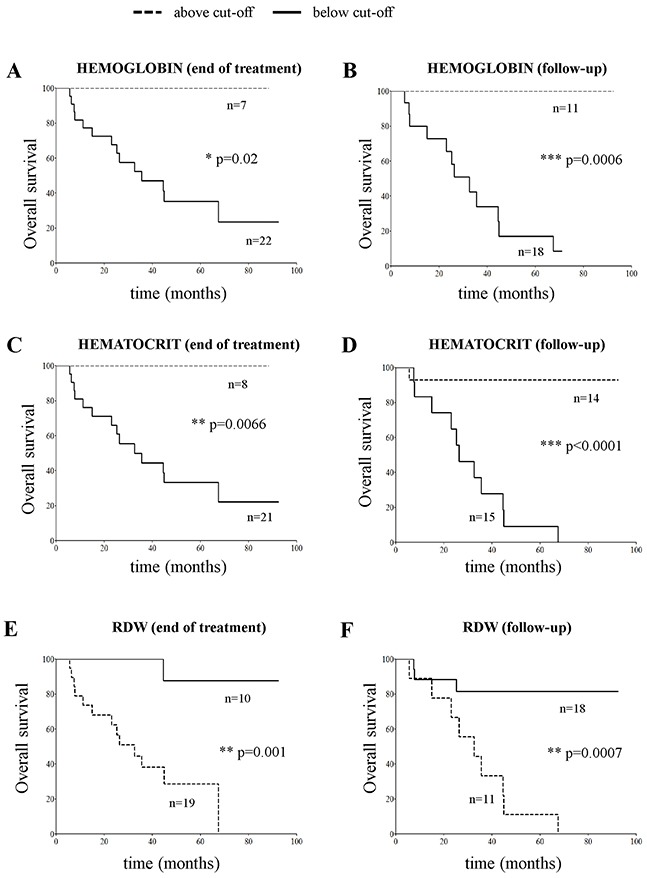
Neuroblastoma (NB) is a pediatric tumor presenting at diagnosis either as localized or metastatic disease, which mainly involves the bone marrow (BM). The physical occupancy of BM space by metastatic NB cells has been held responsible for impairment of BM function. Here, we investigated whether localized or metastatic NB may alter hematopoietic lineages' maturation and release of mature cells in the periphery, through gene expression profiling, analysis of BM smears, cell blood count and flow cytometry analysis. Gene ontology and disease-associated analysis of the genes significantly under-expressed in BM resident cells from children with localized and metastatic NB, as compared to healthy children, indicated anemia, blood group antigens, and heme and porphyrin biosynthesis as major functional annotation clusters. Accordingly, in children with NB there was a selective impairment of erythrocyte maturation at the ortho-chromic stage that resulted in reduced erythrocyte count in the periphery, regardless of the presence of metastatic cells in the BM. By considering all NB patients, low erythrocyte count at diagnosis associated with worse survival. Moreover, in the subset of metastatic patients, low erythrocyte count, hemoglobin and hematocrit and high red cell distribution width at follow-up also associated with worse outcome. These observations provide an alternative model to the tenet that infiltrating cells inhibit BM functions due to physical occupancy of space and may open a new area of research in NB to understand the mechanism(s) responsible for such selective impairment.
Keywords: bone marrow; erythrocytes; microenvironment; neuroblastoma; survival.
Conflict of interest statement
CONFLICTS OF INTEREST The authors declare no conflicts of interest.
Figures
References
-
- Schwab M. MYCN amplification in neuroblastoma: a paradigm for the clinical use of an oncogene. Pathol Oncol Res. 1997;3:3–7. - PubMed
-
- Schwab M, Alitalo K, Klempnauer KH, Varmus HE, Bishop JM, Gilbert F, Brodeur G, Goldstein M, Trent J. Amplified DNA with limited homology to myc cellular oncogene is shared by human neuroblastoma cell lines and a neuroblastoma tumour. Nature. 1983;305:245–248. - PubMed
-
- Brodeur GM, Seeger RC, Schwab M, Varmus HE, Bishop JM. Amplification of N-myc in untreated human neuroblastomas correlates with advanced disease stage. Science. 1984;224:1121–1124. - PubMed
LinkOut - more resources
Full Text Sources
Other Literature Sources
Molecular Biology Databases
