. 2017 Jul 15;33(14):i75-i82.
doi: 10.1093/bioinformatics/btx229.

Orthologous Matrix (OMA) algorithm 2.0: more robust to asymmetric evolutionary rates and more scalable hierarchical orthologous group inference

Affiliations

Orthologous Matrix (OMA) algorithm 2.0: more robust to asymmetric evolutionary rates and more scalable hierarchical orthologous group inference

Clément-Marie Train et al. Bioinformatics. .

Abstract

Motivation: Accurate orthology inference is a fundamental step in many phylogenetics and comparative analysis. Many methods have been proposed, including OMA (Orthologous MAtrix). Yet substantial challenges remain, in particular in coping with fragmented genes or genes evolving at different rates after duplication, and in scaling to large datasets. With more and more genomes available, it is necessary to improve the scalability and robustness of orthology inference methods.

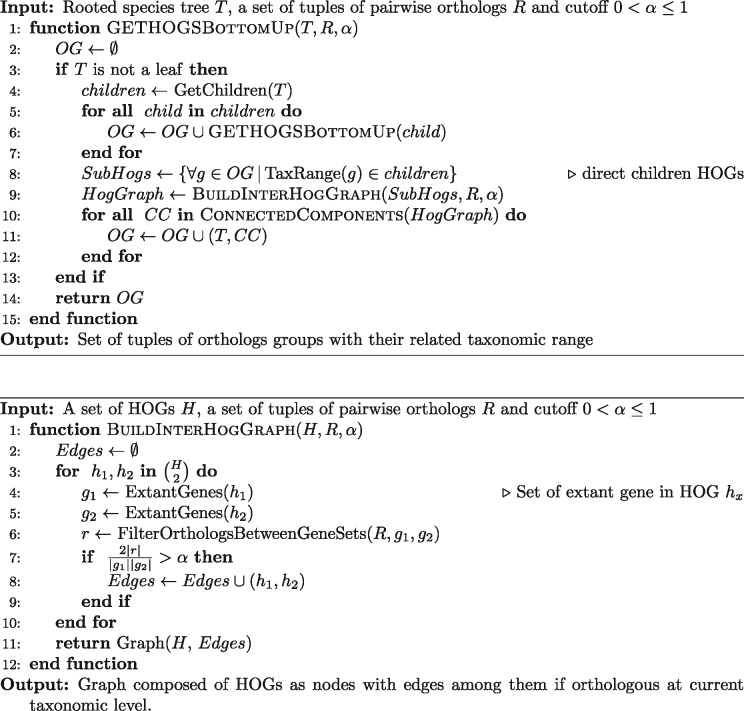
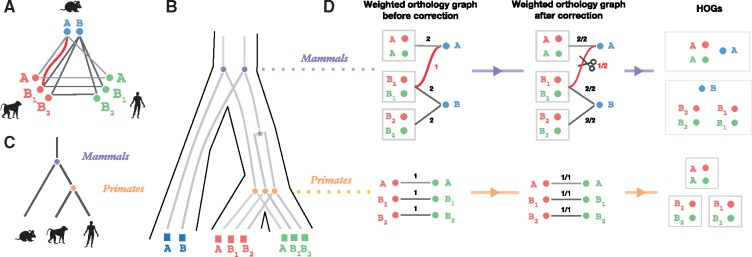
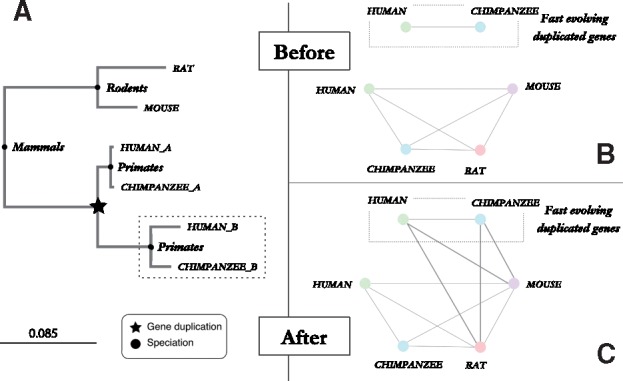
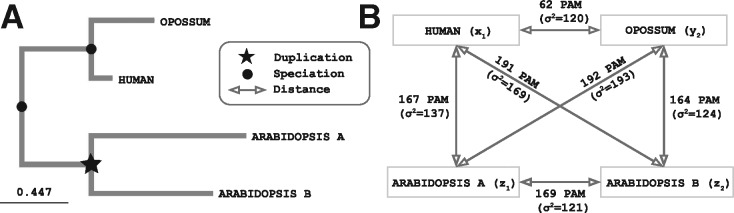
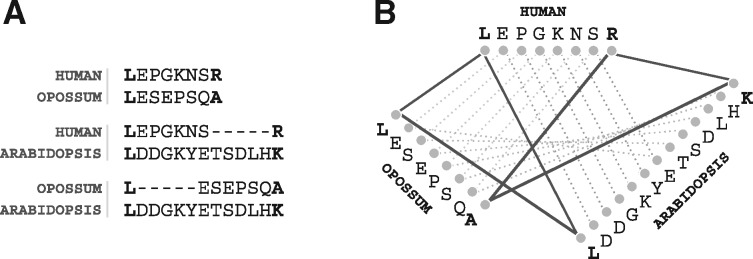
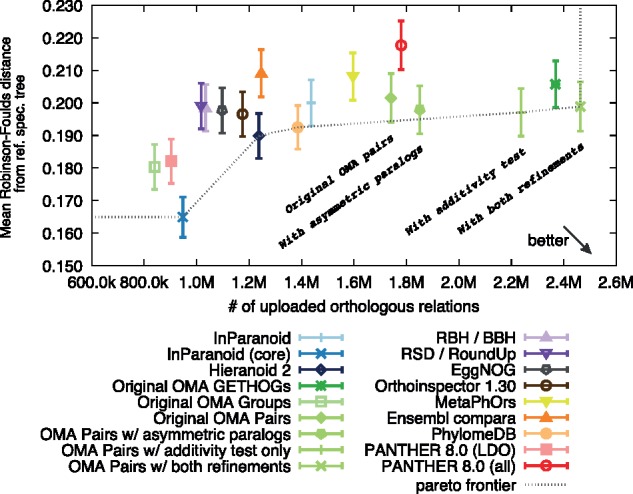
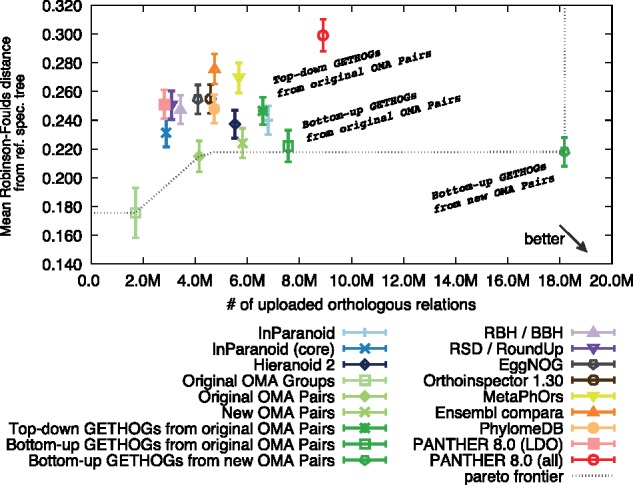
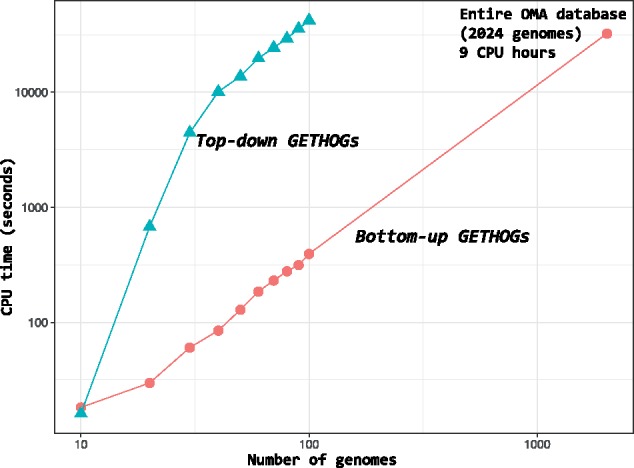
Results: We present improvements in the OMA algorithm: (i) refining the pairwise orthology inference step to account for same-species paralogs evolving at different rates, and (ii) minimizing errors in the pairwise orthology verification step by testing the consistency of pairwise distance estimates, which can be problematic in the presence of fragmentary sequences. In addition we introduce a more scalable procedure for hierarchical orthologous group (HOG) clustering, which are several orders of magnitude faster on large datasets. Using the Quest for Orthologs consortium orthology benchmark service, we show that these changes translate into substantial improvement on multiple empirical datasets.

Availability and implementation: This new OMA 2.0 algorithm is used in the OMA database ( http://omabrowser.org ) from the March 2017 release onwards, and can be run on custom genomes using OMA standalone version 2.0 and above ( http://omabrowser.org/standalone ).

Contact: christophe.dessimoz@unil.ch or adrian.altenhoff@inf.ethz.ch.


Figures

Fig. 1
Fig. 1
Hierarchical Orthologous Groups. Labeled gene tree (left) and its related species tree (right) illustrating the evolutionary history of five genes all descended from a single common ancestral at the tetrapods level. Those homologs can be classified as orthologs if they start diverging by speciation (human versus dog genes of same color) or as paralogs if they start diverging by duplication (blue versus red genes). We can identify in this example HOGs at two taxonomic levels: one larger HOG at the tetrapods level (dotted-line rectangle) containing all the homologous genes that emerged from the single tetrapod ancestral gene, and two HOGs at the mammalian level (solid-line rectangles), due to a duplication of the tetrapod ancestral gene before the mammals speciation
Fig. 2
Fig. 2
Overview of the OMA pipeline. Boxes denote individual steps in the pipeline, while the text outside boxes denotes the input or output of these processes and their terminology in OMA
Fig. 3
Fig. 3
Putative evolutionary scenario for a gene triplet containing 1 human gene and 2 asymmetrically evolving dog genes. (A) Reconciled labeled gene tree for the gene triplet where the red dog gene (orthologous to the human gene) evolved at faster rate of evolution. (B) Reconciled labeled gene tree for the gene triplet where an ancestral duplication gave rise on one side to the blue dog gene and the black human gene and on the other side only to the red dog gene, since the related gray human gene had been lost. The red dog gene is thus paralogous to the black human gene
Fig. 4
Fig. 4
Hidden paralogs example and witness of non-orthology gene quartet. (A) Example of labeled gene tree containing hidden paralogs due to asymmetric gene losses between human and mouse. This can occur when an ancestral duplication is first followed by a speciation then by asymmetric genes losses. The resulting paralogs are wrongly inferred as orthologs because they are the mutually closest pairs between two genomes (Human1, Mouse2 sequences). OMA attempts to identify such cases through the use of a third species (here a monkey) that has retained both copies, which can act as witnesses of non-orthology.(B) The four extant genes form a quartet with branches labeled a–e
Fig. 5
Fig. 5
Pseudocode of bottom-up GETHOGs algorithm
Fig. 6
Fig. 6
Bottom-up GETHOGs reconstruction example. (A) Orthology graph, where circles represent extant genes with a species-specific color and edges represent pairwise orthologous relations between genes. The red edge represents a spurious orthologous relation between the mouse gene A and the monkey gene B1. (B) Reconciled gene trees corresponding to the orthology graph in (A). Extant genes are represented by squares, speciation events by circles and duplication events by stars. (C) Corresponding species tree. (D) HOGs reconstruction using bottom-up GETHOGs with a minimal edges removal threshold of 0.8. The algorithm starts by reconstructing HOGs at the level of the primates and finishes at the level of mammals. The left panel displays the sub-orthology graph composed of HOGs (or extant genes) as nodes connected by weighted edges according to the number of existing orthologous relations between HOG genes. In the middle panel, to identify spurious edges, GETHOGs computes the fraction of orthologous pairs over the maximal number of possible pairs. The algorithm removes the red edge because the score is smaller than the minimal edge removal threshold. The right panel depicts the HOGs reconstructed from the connected component of the corrected graph
Fig. 7
Fig. 7
Analysis of haptoglobin gene family in mammals. (A) Phylogenetic labeled gene tree of the haptoglobin family built using 6 proteins sequences from 4 mammals (rat, mouse, human, chimpanzee). The dotted rectangle highlights the fast evolving primate paralogous genes. (B,C) Orthology graph of the haptoglobin gene family shown in A. Nodes represent extant genes denoted by a species-specific color and their identifier meanwhile the edges represent pairwise orthologous relations between genes. The orthology graph in B, relies on the pairwise orthologous relations inferred using the classic OMA algorithm, while the orthology graph in C is built using the orthology relations including the refinement for paralogs evolving at different rates. (UniProt IDs of the sequences involved Mouse→Q16646, Rat→A0A0H2UHM3, Human_a→HOY300, Chimpanzee_a→H2RAT6, Human_b→P00739, Chimpanzee_b→H2RB63)
Fig. 8
Fig. 8
Example of non additivity among gene quartet distances. (A). The two Arabidopsis genes arose from a duplication within the plants, which can be inferred from a tree inferred using a multiple sequence alignment. (B) However, if we consider pairwise distances estimated from independent pairwise alignments, one Arabidopsis gene appears to be closer to the human sequence, while the other appears to be closer to the opossum gene. In the original OMA algorithm, this would result in these Arabidopsis genes being erroneously used as witnesses of non-orthology; in the new algorithm, the non additivity of these distances (in Point Accepted Mutation units, with estimator variance in parentheses) is detected and the Arabidospsis genes are not used. (UniProt IDs of sequence involved: Human → Q16874, Opossum → F7FI80, Arabidopsis a → Q93ZB2, Arabidopsis b → Q9LNJ4)
Fig. 9
Fig. 9
Example of non conservation of homologous sites across independent pairwise alignments. (A) Excerpts of three pairwise alignments between three sequences. (B) Graph-representation of the three alignments, where lines connect aligned residues. The lines are depicted as full lines if the characters are aligned consistently—thus forming closed triangles—and as dotted lines if they are aligned inconsistently—thus forming open triangles. (Sequence mapping to Uniprot Id: Human → H. sapiens|Q16874, Opossum → M. domestica|F7FI80, Arabidopsis → A. thaliana|Q93ZB2.)
Fig. 10
Fig. 10
Effect of the refinements on pairwise orthology relationships (OMA Pairs) in the generalized species tree discordance test at vertebrate level. The asymmetric paralogs denotes the change in the OMA algorithm aiming to include fast evolving duplicated genes during orthology inferences. The additivity test denotes the new quartet consistency test added to the witness of non-orthology step. Error bars denote the 95% CI of the mean
Fig. 11
Fig. 11
Assessment of HOG inference on the generalized species tree discordance test (eukaryotic dataset). Error bars denote the 95% CI of the mean. The data points with ‘original OMA’ refer to the algorithm used before this study and ‘new OMA’ refer to the predictions produced by the refinements introduced in section 2.3
Fig. 12
Fig. 12
Time performance of GETHOGs algorithm. CPU time to compute the HOGs reconstruction on dataset of different sizes. The timing is recorded on a single instance running on a Intel(R) Xeon(R) CPU E5540 2.53GHz

References

    1. Altenhoff A.M. et al. (2013) Inferring hierarchical orthologous groups from orthologous gene pairs. PLoS One, 8, e53786.. - PMC - PubMed
    1. Altenhoff A.M. et al. (2016) Standardized benchmarking in the quest for orthologs. Nat. Methods, 13, 425–430. - PMC - PubMed
    1. Altenhoff A.M. et al. (2015) The OMA orthology database in 2015: function predictions, better plant support, synteny view and other improvements. Nucleic Acids Res., 43, D240–D249. - PMC - PubMed
    1. Altenhoff A.M., Dessimoz C. (2009) Phylogenetic and functional assessment of orthologs inference projects and methods. PLoS Comput. Biol., 5, e1000262.. - PMC - PubMed
    1. Ballesteros J.A., Hormiga G. (2016) A new orthology assessment method for phylogenomic data: unrooted phylogenetic orthology. Mol. Biol. Evol., 33, 2481. - PubMed