. 2017 Jul 15;33(14):i333-i340.
doi: 10.1093/bioinformatics/btx241.

Molecular signatures that can be transferred across different omics platforms

Affiliations

Molecular signatures that can be transferred across different omics platforms

M Altenbuchinger et al. Bioinformatics. .

Erratum in

  • Molecular signatures that can be transferred across different omics platforms.
    Altenbuchinger M, Schwarzfischer P, Rehberg T, Reinders J, Kohler CW, Gronwald W, Richter J, Szczepanowski M, Masqué-Soler N, Klapper W, Oefner PJ, Spang R. Altenbuchinger M, et al. Bioinformatics. 2017 Sep 1;33(17):2790. doi: 10.1093/bioinformatics/btx488. Bioinformatics. 2017. PMID: 28903540 Free PMC article. No abstract available.

Abstract

Motivation: Molecular signatures for treatment recommendations are well researched. Still it is challenging to apply them to data generated by different protocols or technical platforms.

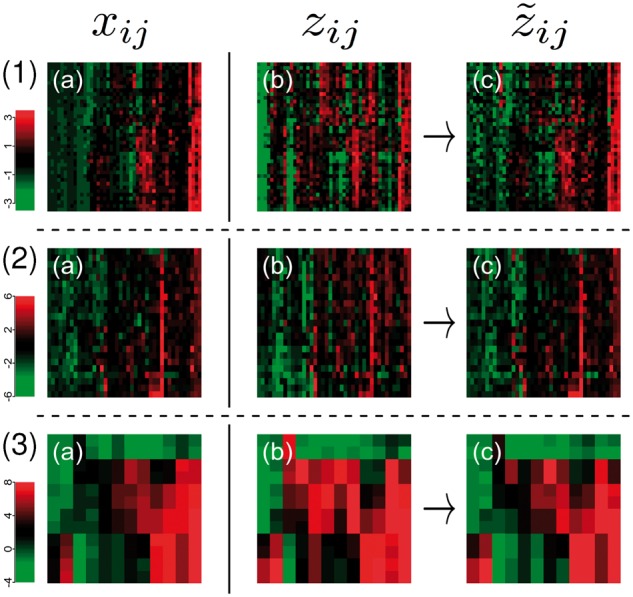
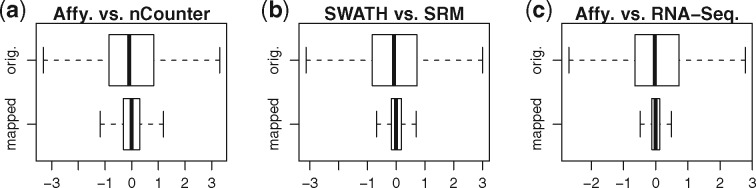
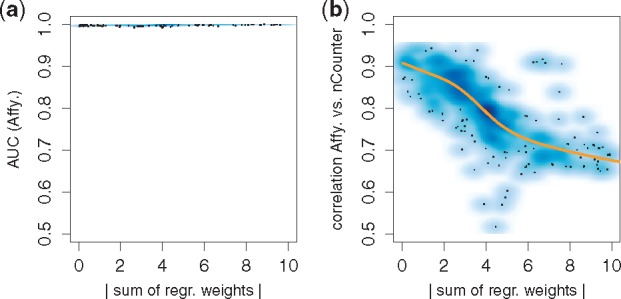
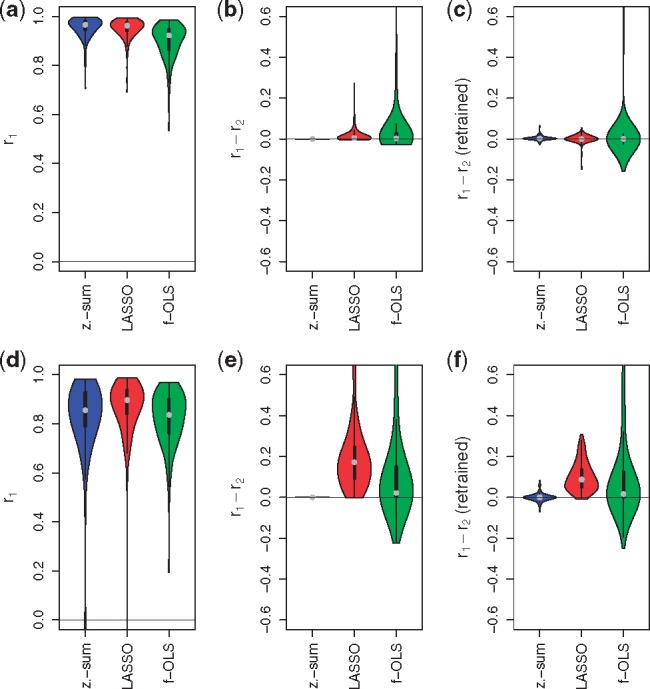
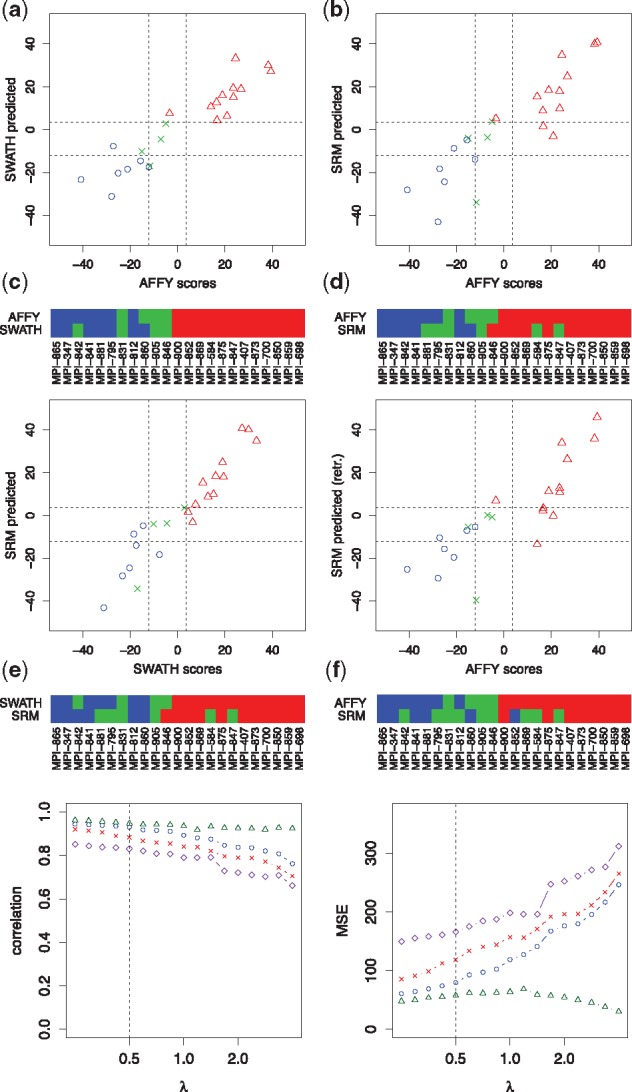
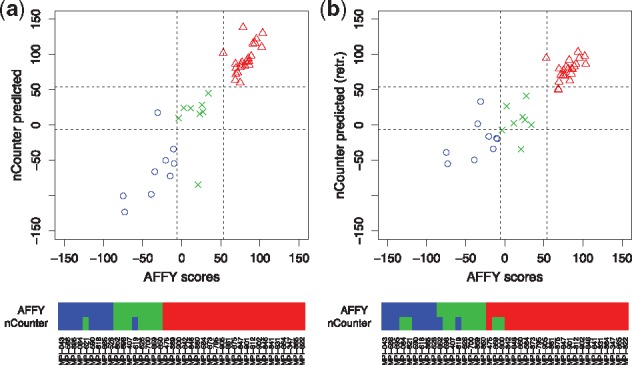
Results: We analyzed paired data for the same tumors (Burkitt lymphoma, diffuse large B-cell lymphoma) and features that had been generated by different experimental protocols and analytical platforms including the nanoString nCounter and Affymetrix Gene Chip transcriptomics as well as the SWATH and SRM proteomics platforms. A statistical model that assumes independent sample and feature effects accounted for 69-94% of technical variability. We analyzed how variability is propagated through linear signatures possibly affecting predictions and treatment recommendations. Linear signatures with feature weights adding to zero were substantially more robust than unbalanced signatures. They yielded consistent predictions across data from different platforms, both for transcriptomics and proteomics data. Similarly stable were their predictions across data from fresh frozen and matching formalin-fixed paraffin-embedded human tumor tissue.

Availability and implementation: The R-package 'zeroSum' can be downloaded at https://github.com/rehbergT/zeroSum . Complete data and R codes necessary to reproduce all our results can be received from the authors upon request.

Contact: rainer.spang@ur.de.


Figures

Fig. 1
Fig. 1
Comparison and adjustment of omics data of the same samples profiled with different technologies and protocols. The first two columns contrast state of the art normalized datasets. Row (1) shows paired gene expression data of the same non-Hodgkin lymphomas using the Affymetrix GeneChip (a) and NanoString nCounter (b) technology. Row (2) shows paired protein expression data acquired by SWATH (a) and SRM (b), for a subset of the non-Hodgkin lymphomas. And Row (3) shows paired expression levels of activated T cells for microarray (a) and RNA-Seq data (b). Column (c) shows heatmaps for the datasets (b) adjusted to match the datasets (a) using our model. Columns always correspond to molecular features (mRNA or protein) and rows to samples
Fig. 2
Fig. 2
Most of the inter-technical variability can be explained by our independent effects model. Figures (a) to (c) show box plots of the differences between data generated by different technologies. The plots on top show the original non-adjusted but individually normalized data, while those below compare adjusted datasets. 69%-94% of inter-technical variability could be explained by our model
Fig. 3
Fig. 3
Comparing classifications across technologies: Plot (a) shows the absolute sum of regression weights for 1000 signatures trained on re-sampled data from technology 1 (Affymetrix) plotted against their classification performances (area under the receiver operating characteristic curve (AUC)) on independent data of the same technology. All signatures perform excellent independent of their strongly varying weights. The y-axis of Figure (b) shows the correlation (agreement) of classification scores for data of technology 1 (Affymetrix) and 2 (nanoString). Predictions from signatures with balanced weights (x-axis near zero) agree well across technologies, while unbalanced signatures produce conflicting predictions on the second technology
Fig. 4
Fig. 4
Simulation results: Correlations between predicted and true responses for simulation scenario A (top) and B (bottom) summarized in Table 1. Models were trained using zero-sum regression (z.-sum), LASSO and OLS with feature filtering (abbreviated as f-OLS). Plots (a) and (d) show correlations between true and predicted responses for simulated technology 1 data, r1=cor(y^1,y), for scenario A and B, respectively. Zero-sum regression can compete with the standard LASSO and out competes f-OLS on consistent data from the same technology. Plots (b) and (e) show correlation differences for simulated technology 1 and technology 2 data. The signatures were trained on simulated technology 1 data and applied unchanged to simulated technology 2 data. For the simulation with balanced weights (top) both zero-sum and LASSO show good agreement across datasets, while for unbalanced weights (bottom) the LASSO and f-OLS show systematic reduced agreement across datasets. Plots (c) and (f) also show correlation differences for simulated technology 1 and technology 2 data, but this time the signatures were retrained on simulated technology 2 data. Retraining did not improve the agreement of predictions across technologies
Fig. 5
Fig. 5
DLBCL subtyping using different technological platforms and different biopsy conservation protocols. Plot (a) shows the ABC/GCB gold-standard scores (Affymetrix gene expression) versus zero-sum scores predicted in a leave-one-out cross validation on SWATH proteomics data. The scores from both technologies agree well. The dashed lines are classification boundaries for ABC, unclassified and GCB, derived from the gold-standard scores. The color bars below the plot contrast the resulting classifications showing an excellent agreement between the proteomics predictions and the gold standard classifications. Similarly, Plot (b), shows gold-standard scores versus scores predicted on SRM data. Here, the original SWATH signature was applied on the SRM data directly, where only the offset β0 was retrained. The SWATH signature carried over well to SRM data. Plot (c) shows SWATH versus SRM predictions with excellent agreement. Plot (d) shows scores predicted on SRM versus the gold standard scores, where this time the signature was completely retrained on SRM data. The retrained signature was inferior to the SWATH trained zero-sum signature in (b). All signatures were trained for the penalizing parameter λ = 0.5. In all four figures, (a–d), GCBs are indicated in red (triangles), ABCs in blue (circles) and unclassified cases in green (crosses). The dependence of correlations and mean squared errors of Figure (a) to (d) on λ is shown in Figure (e) and (f). Comparison (a) corresponds to the blue circles, (b) to the red crosses, (c) to the green triangles and (d) to the purple diamonds
Fig. 6
Fig. 6
Differential diagnosis of mBL and DLBCL. Figure (a) shows mBL scores predicted on FFPE data (nanoString) versus the gold standard scores from fresh frozen material (Affymetrix). The signature was trained by zero-sum regression on GeneChip data and was directly applied to the FFPE data, where only the offset β0 was readjusted in cross validation. The color bars below the plot contrast the resulting classifications showing an excellent agreement between the FFPE predictions and the gold standard classifications. In Figure (b) the FFPE nCounter scores were obtained by a leave-one-out cross validation, where the signature was retrained on the nCounter data. Retraining did not yield any advantages over the original zero-sum signature. In both figures, DLBCLs are indicated in red (triangles), mBLs in blue (circles) and intermediate cases in green (crosses)

References

    1. Alizadeh A.A. et al. (2000) Distinct types of diffuse large B-cell lymphoma identified by gene expression profiling. Nature, 403, 503–511. - PubMed
    1. Altenbuchinger M. et al. (2017) Reference point insensitive molecular data analysis. Bioinformatics, 33, 219–226. - PubMed
    1. Dave S.S. et al. (2006) Molecular diagnosis of Burkitt’s lymphoma. N. Engl. J. Med., 354, 2431–2442. - PubMed
    1. Deeb S.J. et al. (2012) Super-SILAC allows classification of diffuse large B-cell lymphoma subtypes by their protein expression profiles. Mol. Cell. Proteomics, 11, 77–89. - PMC - PubMed
    1. Faktor J. et al. (2016) Comparison of targeted proteomics approaches for detecting and quantifying proteins derived from human cancer tissues. Proteomics, 17, S.1600323. - PubMed