. 2017 Jul 15;33(14):i359-i368.
doi: 10.1093/bioinformatics/btx266.

Systematic identification of feature combinations for predicting drug response with Bayesian multi-view multi-task linear regression

Affiliations

Systematic identification of feature combinations for predicting drug response with Bayesian multi-view multi-task linear regression

Muhammad Ammad-Ud-Din et al. Bioinformatics. .

Abstract

Motivation: A prime challenge in precision cancer medicine is to identify genomic and molecular features that are predictive of drug treatment responses in cancer cells. Although there are several computational models for accurate drug response prediction, these often lack the ability to infer which feature combinations are the most predictive, particularly for high-dimensional molecular datasets. As increasing amounts of diverse genome-wide data sources are becoming available, there is a need to build new computational models that can effectively combine these data sources and identify maximally predictive feature combinations.

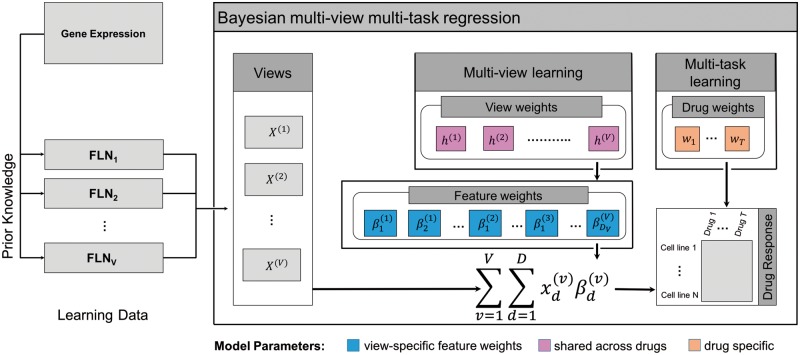
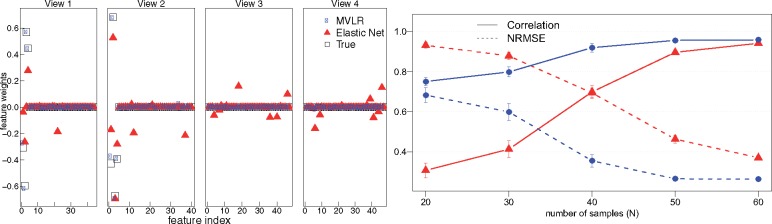
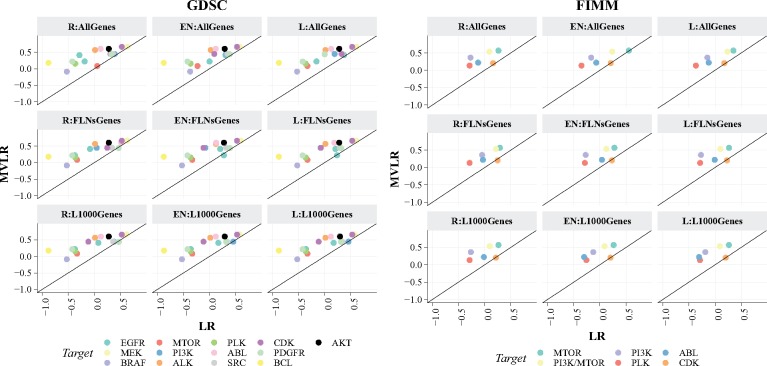
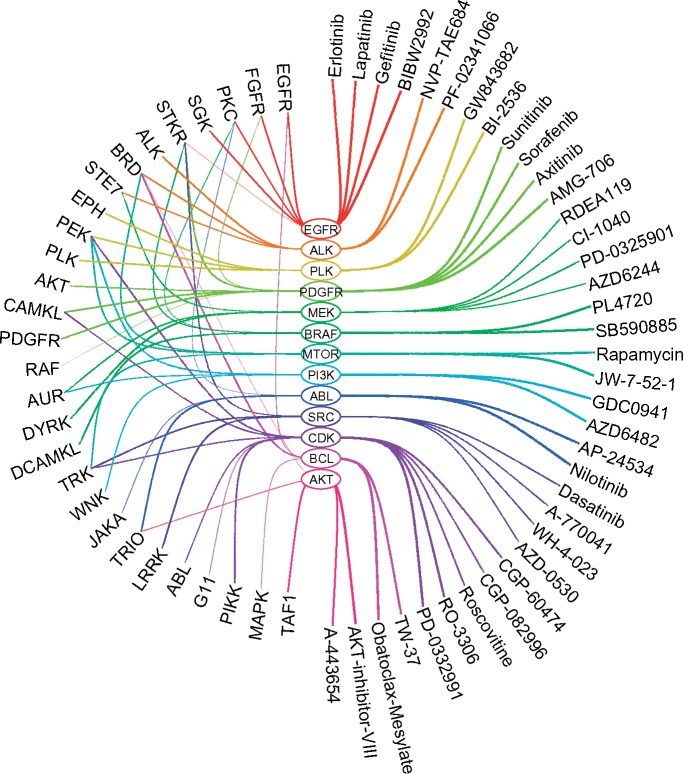
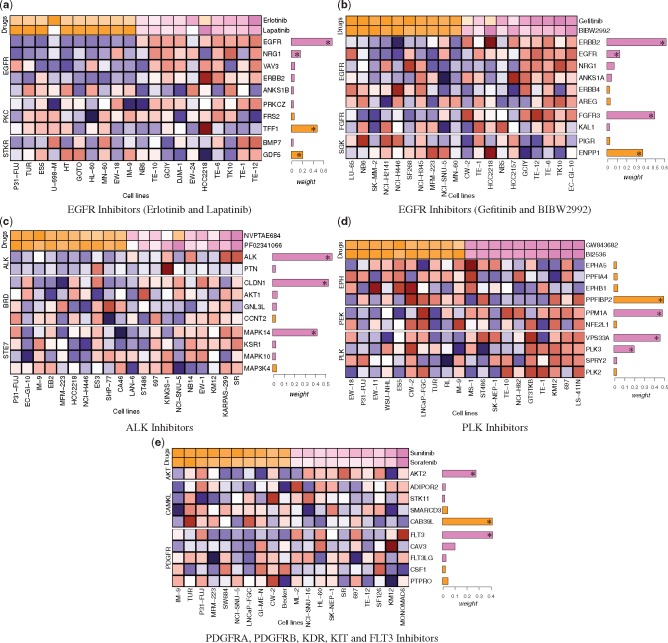
Results: We present a novel approach that leverages on systematic integration of data sources to identify response predictive features of multiple drugs. To solve the modeling task we implement a Bayesian linear regression method. To further improve the usefulness of the proposed model, we exploit the known human cancer kinome for identifying biologically relevant feature combinations. In case studies with a synthetic dataset and two publicly available cancer cell line datasets, we demonstrate the improved accuracy of our method compared to the widely used approaches in drug response analysis. As key examples, our model identifies meaningful combinations of features for the well known EGFR, ALK, PLK and PDGFR inhibitors.

Availability and implementation: The source code of the method is available at https://github.com/suleimank/mvlr .

Contact: muhammad.ammad-ud-din@helsinki.fi or suleiman.khan@helsinki.fi.

Supplementary information: Supplementary data are available at Bioinformatics online.


Figures

Fig. 1.
Fig. 1.
Flow chart of the Bayesian multi-view multi-task linear regression approach. Left: The learning data consists of multiple data sources (here FLNs) extracted using prior knowledge and denoted by X(1)..X(V). Right: The model combines multi-view and multi-task learning to systematically identify feature combinations (β1(1),β2(1),β1(2),β1(3),βDv(v)) predictive of drug responses. The view-weights h(v) control the view-specific feature weights β(v) which are predictive of the drug responses and are shared across all the drugs. This structured formulation allows identification of predictive views as well as features. The responses of multiple drugs are modeled by drug specific weights wt
Fig. 2.
Fig. 2.
Performance of the method on synthetic dataset. Left: The figure demonstrates the models functionality by effectively shutting down excessive views to prune the search space, and its ability to identify the features weights correctly. The true weights corresponding to the four views are shown along with the weights learned by our model and elastic net regression. The view-sparsity in MVLR shuts down the irrelevant views. Right: Prediction performance of our model and the comparison approach when the number of sample size is varied. Each point represents the average prediction performance over 50 experiments with error bars indicating one standard error over the mean. The structured sparsity assumptions of our model are especially beneficial when the sample sizes are small in comparison to the number of dimensions
Fig. 3.
Fig. 3.
Spearman correlations on individual drug groups colored according to their primary target, computed across cell lines. Left: GDSC dataset, Right: FIMM dataset. Table 2 explains the method abbreviations. The predictive performance obtained by MVLR (shown on y-axis) for both datasets is found to be significantly higher than the others shown on x-axis (P <0.05; one-sided paired Wilcoxon signed-rank test corrected for multiple testing). Here, negative correlations correspond to poor performance as the baseline performance is –1, which is obtained using the mean of the training drug response data as predictions for the test sample
Fig. 4.
Fig. 4.
FLNs-drug response relationships in the GDSC dataset, visualized as an "eye diagram". For each primary target group (middle) and their corresponding drugs (right), and the top three predictive FLNs (left) are shown. (a) EGFR Inhibitors (Erlotinib and Lapatinib). (b) EGFR Inhibitors (Gefitinib and BIBW2992). (c) ALK Inhibitors. (d) PLK Inhibitors. (e) PDGFRA, PDGFRB, KDR, KIT and FLT3 Inhibitors
Fig. 5.
Fig. 5.
Heatmaps of feature combinations predictive of drug responses (log IC50) for the 10 most sensitive (shown in violet) and resistant (shown in orange) cancer cell lines from the GDSC dataset. For each cell line, gene expression features are shown (blue corresponds to lower expression, red to higher expression). On the right side of each feature is a bar indicating the absolute value of the weight (β of the MVLR model). Bars in violet are negative weights, indicating features associated with sensitivity, and bars in orange are positive weight, indicating features associated with resistance. For clarity, only the top ten features having largest weights from the top three FLNs are shown. Feature weights marked with an asterisk (*) are statistically significant (p¡0.05, permutation test). The gene expression features are grouped based on the FLNs information, denoted on the left of the heatmaps

References

    1. Ammad-Ud Din M. et al. (2014) Integrative and personalized QSAR analysis in cancer by Kernelized Bayesian matrix factorization. J. Chem. Inf. Model, 54, 2347–2359. - PubMed
    1. Ammad-Ud Din M. et al. (2016) Drug response prediction by inferring pathway-response associations with Kernelized Bayesian matrix factorization. Bioinformatics, 32, i455–i463. - PubMed
    1. Barretina J. et al. (2012) The cancer cell line encyclopedia enables predictive modelling of anticancer drug sensitivity. Nature, 483, 603–607. - PMC - PubMed
    1. Basu A. et al. (2013) An interactive resource to identify cancer genetic and lineage dependencies targeted by small molecules. Cell, 154, 1151–1161. - PMC - PubMed
    1. Carpenter B. et al. (2017) Stan: a probabilistic programming language. J. Stat. Software, 76, 1–32. - PMC - PubMed

Substances