. 2017 Sep 7;36(1):122.
doi: 10.1186/s13046-017-0592-3.

Intrinsic fluorescence of the clinically approved multikinase inhibitor nintedanib reveals lysosomal sequestration as resistance mechanism in FGFR-driven lung cancer

Affiliations

Intrinsic fluorescence of the clinically approved multikinase inhibitor nintedanib reveals lysosomal sequestration as resistance mechanism in FGFR-driven lung cancer

Bernhard Englinger et al. J Exp Clin Cancer Res. .

Abstract

Background: Studying the intracellular distribution of pharmacological agents, including anticancer compounds, is of central importance in biomedical research. It constitutes a prerequisite for a better understanding of the molecular mechanisms underlying drug action and resistance development. Hyperactivated fibroblast growth factor receptors (FGFRs) constitute a promising therapy target in several types of malignancies including lung cancer. The clinically approved small-molecule FGFR inhibitor nintedanib exerts strong cytotoxicity in FGFR-driven lung cancer cells. However, subcellular pharmacokinetics of this compound and its impact on therapeutic efficacy remain obscure.

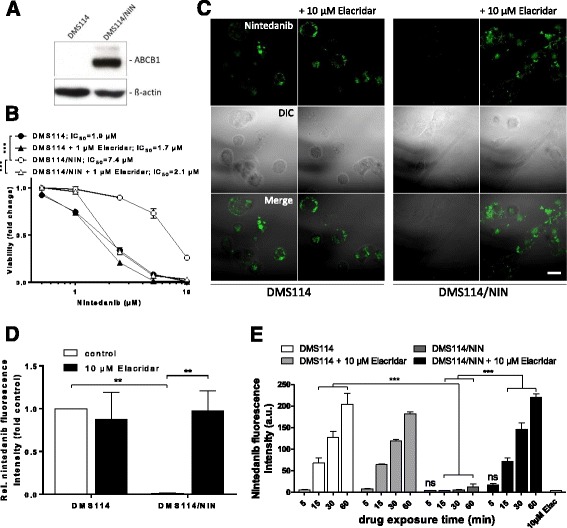
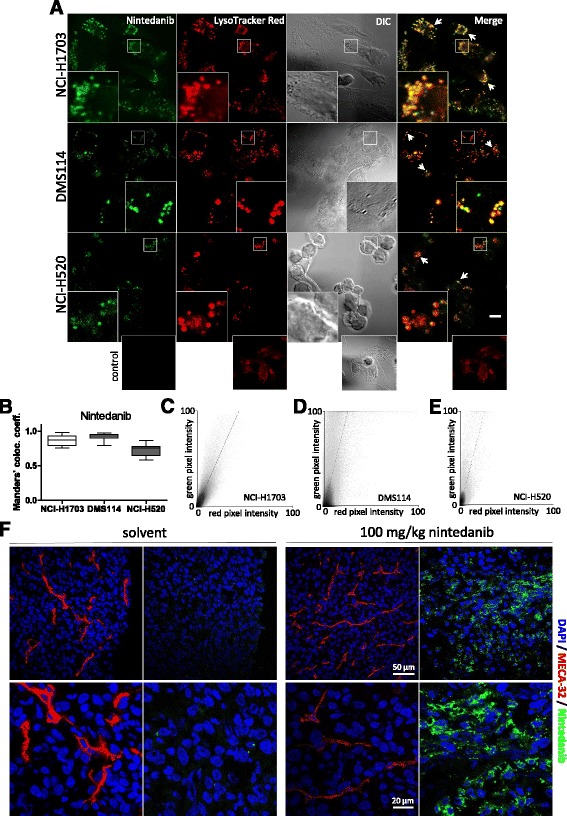
Methods: 3-dimensional fluorescence spectroscopy was conducted to asses cell-free nintedanib fluorescence properties. MTT assay was used to determine the impact of the lysosome-targeting agents bafilomycin A1 and chloroquine combined with nintedanib on lung cancer cell viability. Flow cytometry and live cell as well as confocal microscopy were performed to analyze uptake kinetics as well as subcellular distribution of nintedanib. Western blot was conducted to investigate protein expression. Cryosections of subcutaneous tumor allografts were generated to detect intratumoral nintedanib in mice after oral drug administration.

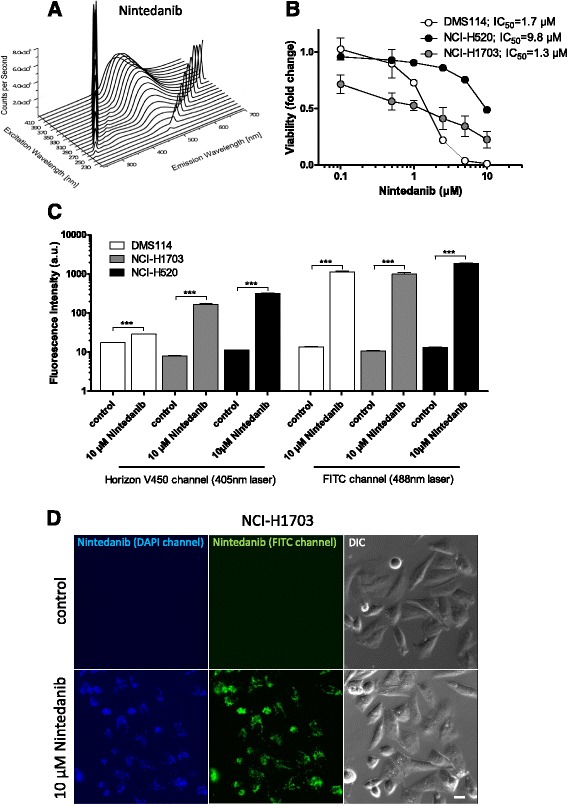
Results: Here, we report for the first time drug-intrinsic fluorescence properties of nintedanib in living and fixed cancer cells as well as in cryosections derived from allograft tumors of orally treated mice. Using this feature in conjunction with flow cytometry and confocal microscopy allowed to determine cellular drug accumulation levels, impact of the ABCB1 efflux pump and to uncover nintedanib trapping into lysosomes. Lysosomal sequestration - resulting in an organelle-specific and pH-dependent nintedanib fluorescence - was identified as an intrinsic resistance mechanism in FGFR-driven lung cancer cells. Accordingly, combination of nintedanib with agents compromising lysosomal acidification (bafilomycin A1, chloroquine) exerted distinctly synergistic growth inhibitory effects.

Conclusion: Our findings provide a powerful tool to dissect molecular factors impacting organismal and intracellular pharmacokinetics of nintedanib. Regarding clinical application, prevention of lysosomal trapping via lysosome-alkalization might represent a promising strategy to circumvent cancer cell-intrinsic nintedanib resistance.

Keywords: FGFR1; Fluorescence; Lysosomes; Nintedanib; Resistance.


Conflict of interest statement

Ethics approval and consent to participate

Animal experiments were authorized by the Ethics committee at the Medical University of Vienna and carried out in accordance with the guidelines for the welfare and use of animals in cancer research, as well as meeting the Federation of Laboratory Animal Science Associations (FELASA) guidelines’ definition of humane endpoints and the Arrive guidelines for animal care and protection.

Consent for publication

Not applicable.

Competing interests

The authors declare that they have no competing interests.

Publisher’s Note

Springer Nature remains neutral with regard to jurisdictional claims in published maps and institutional affiliations.

Figures

Fig. 1
Fig. 1
Nintedanib exhibits intracellular and cell-free intrinsic fluorescence activity. a Full excitation-emission 3D landscape was obtained by fluorescence spectroscopy to elucidate cell-free fluorescence properties of nintedanib. Spectra are shown for excitation wavelengths from 220 nm to 420 nm. Emission was measured from 240 to 700 nm. 1st and 2nd order Rayleigh scattering can be seen as diagonal ridges. b Viability of DMS114, NCI-H520 and NCI-H1703 lung cancer cells was analyzed by MTT assay after 72 h exposure to the indicated concentrations of nintedanib. c Intracellular fluorescence activity of 10 μM nintedanib in DMS114, NCI-H1703 and NCI-H520 cells after 1 h exposure was measured by flow cytometry. Fluorescence emission was analyzed using the Horizon V450 channel (450/40 nm bandpass filter) for the 405 nm laser and the FITC channel (530/30 nm bandpass filter) for the 488 nm laser. *** p < 0.001, students’s t-test. d Blue and green fluorescence activity in NCI-H1703 cells, treated for 1 h with 10 μM nintedanib was analyzed by live cell microscopy. The scale bar indicates 10 μm
Fig. 2
Fig. 2
Dose- and time-dependent detection of intracellular nintedanib accumulation by flow cytometry and live cell microscopy. a-c Time-dependent intracellular fluorescence activity of indicated concentrations of nintedanib in NCI-H1703 (a), DMS114 (b) and NCI-H520 cells (c) was measured by flow cytometry. Nintedanib was detected using the 488 nm laser. Signals are plotted as arbitrary units. Mean autofluorescence values were 6.3, 7.9 and 6.6 for NCI-H1703, DMS114 and NCI-H520, respectively. * p < 0.05, *** p < 0.001, 2-way ANOVA, Tukey’s post-test. ns, non-significant. Statistical significance is indicated by the asterisks and includes testing of all time-points between each drug concentration. d Intracellular accumulation of 10 μM nintedanib in NCI-H1703 cells over time was analyzed by live cell microscopy. The scale bar indicates 10 μm. e Quantification of nintedanib pixel intensities of representative micrographs from (D). Signals derived from individual cells are plotted as arbitrary units. The mean value for the 0 min control was 0.003. *** p < 0.001, 1-way ANOVA, Tukey’s post-test
Fig. 3
Fig. 3
Fluorescence-based monitoring of ABCB1-mediated reduction of intracellular nintedanib levels. a Expression of ABCB1 in DMS114 cells and their isogenic nintedanib-resistant counterpart DMS114/NIN was analyzed by Western blot. ß-actin served as loading control. b Impact of ABCB1 inhibition by elacridar on the cytotoxic activity of nintedanib in DMS114 cells and their resistant subline was analyzed by MTT assay 72 h after drug exposure. *** p < 0.001, 2-way ANOVA, Tukey’s post-test. c Impact of 10 μM elacridar on the intracellular accumulation of 10 μM nintedanib in DMS114 and DMS114/NIN cells was analyzed by confocal fluorescence microscopy after 1 h drug exposure. The scale bar indicates 10 μm. d Quantification of relative fluorescence intensities of micrographs shown in (c) is plotted normalized to nintedanib-treated DMS114 control cells. *** p < 0.001, 2-way ANOVA, Tukey’s post-test. e Impact of 10 μM elacridar on the intracellular accumulation of 10 μM nintedanib in DMS114 and DMS114/NIN cells was measured at the indicated time-points by flow cytometry using the FITC channel. *** p < 0.001, 2-way ANOVA, Tukey’s post-test. ns non-significant
Fig. 4
Fig. 4
Nintedanib selectively localizes to lysosomes and nintedanib fluorescence is detectable in tumor specimen of treated animals. a Subcellular distribution of 10 μM nintedanib in NCI-H1703, DMS114 and NCI-H520 cells after 1 h drug exposure was analyzed by confocal fluorescence microscopy in the FITC channel. LysoTracker® Red served as marker for the lysosomal compartment. Cell boundaries were imaged in the DIC channel. The arrows indicate regions of distinct drug/LysoTracker® Red spatial overlap. The scalebar indicates 10 μm. b Colocalization of nintedanib and lysosome-derived signals was determined using thresholded Manders’ Colocalization Coefficient (MCC). c-e Representative scatter plots showing nintedanib/LysoTracker® Red pixel intensity correlations in NCI-H1703 (c), DMS114 (d) and NCI-H520 (e) cells derived from confocal micrographs shown in Fig. 4a. f Intratumoral nintedanib in tissue cryosections detected by confocal fluorescence microscopy using the FITC channel. Mice bearing subcutaneous CT26 tumor allografts received a single oral dose of 100 mg nintedanib per kg bodyweight or solvent. 2 h after drug administration, mice were sacrificed and consecutive cryosections of OCT-embedded tumors were generated. DAPI served as nuclear counterstain. The endothelial marker MECA-32 was stained to visualize tumor microvasculature. Representative micrographs of tumors are shown from the experiment performed in duplicates
Fig. 5
Fig. 5
Lysosomal alkalization increases cytotoxic potential of nintedanib. a Impact of 1 h bafilomycin A1 pretreatment on the fluorescence activity of nintedanib in NCI-H1703 cells was measured after 1 h drug exposure by flow cytometry using the 405 nm and 488 nm lasers. ns, non-significant, *** p < 0.001, 2-way ANOVA, Tukey’s post-test. b Effect of 1 h bafilomycin A1 pretreatment on total intracellular nintedanib levels was determined at the indicated time-points by HPLC. <LOD, below limit of detection. *** p < 0.001, 2-way ANOVA, Tukey post-test. ns, non-significant. c Impact of 1 h bafilomycin A1 pretreatment on intralysosomal accumulation of 10 μM nintedanib was investigated at the indicated time-points by live cell microscopy. LysoTracker® Red served as marker for the lysosomal compartment. The scale bar indicates 10 μm. d Viability of NCI-H1703 lung cancer cells in the presence or absence of 10 and 25 nM bafilomycin A1 was analyzed by MTT assay after 72 h exposure to the indicated concentrations of nintedanib. *** p < 0.001, 2-way ANOVA, Tukey’s post-test. Asterisks indicate significance of difference at the respective nintedanib concentration points between control and both 10 nM and 25 nM bafilomycin A1. ns, non-significant; e Synergism of nintedanib/bafilomaycin A1 cotreatment of NCI-H1703 cells shown in (d) was determined calculating combination indices (CI) using CalcuSyn software. CI values below 0.9, between 0.9–1.1 or above 1.1 indicated synergism, additivity, and antagonism, respectively

References

    1. Katoh M, Nakagama H. FGF receptors: cancer biology and therapeutics. Med Res Rev. 2014;34:280–300. doi: 10.1002/med.21288. - DOI - PubMed
    1. Turner N, Grose R. Fibroblast growth factor signalling: from development to cancer. Nat Rev Cancer. 2010;10:116–129. doi: 10.1038/nrc2780. - DOI - PubMed
    1. Heinzle C, Sutterluty H, Grusch M, Grasl-Kraupp B, Berger W, Marian B. Targeting fibroblast-growth-factor-receptor-dependent signaling for cancer therapy. Expert Opin Ther Targets. 2011;15:829–846. doi: 10.1517/14728222.2011.566217. - DOI - PubMed
    1. Tanner Y, Grose RP. Dysregulated FGF signalling in neoplastic disorders. Semin Cell Dev Biol. 2016;53:126–135. doi: 10.1016/j.semcdb.2015.10.012. - DOI - PubMed
    1. Saichaemchan S, Ariyawutyakorn W, Varella-Garcia M. Fibroblast growth factor receptors: from the Oncogenic pathway to targeted therapy. Curr Mol Med. 2016;16:40–62. doi: 10.2174/1566524016666151222144231. - DOI - PubMed

Publication types

MeSH terms