. 2018 Jan 1;83(1):50-60.
doi: 10.1016/j.biopsych.2017.06.034. Epub 2017 Jul 21.

Persistent Increase in Microglial RAGE Contributes to Chronic Stress-Induced Priming of Depressive-like Behavior

Affiliations

Persistent Increase in Microglial RAGE Contributes to Chronic Stress-Induced Priming of Depressive-like Behavior

Tina C Franklin et al. Biol Psychiatry. .

Abstract

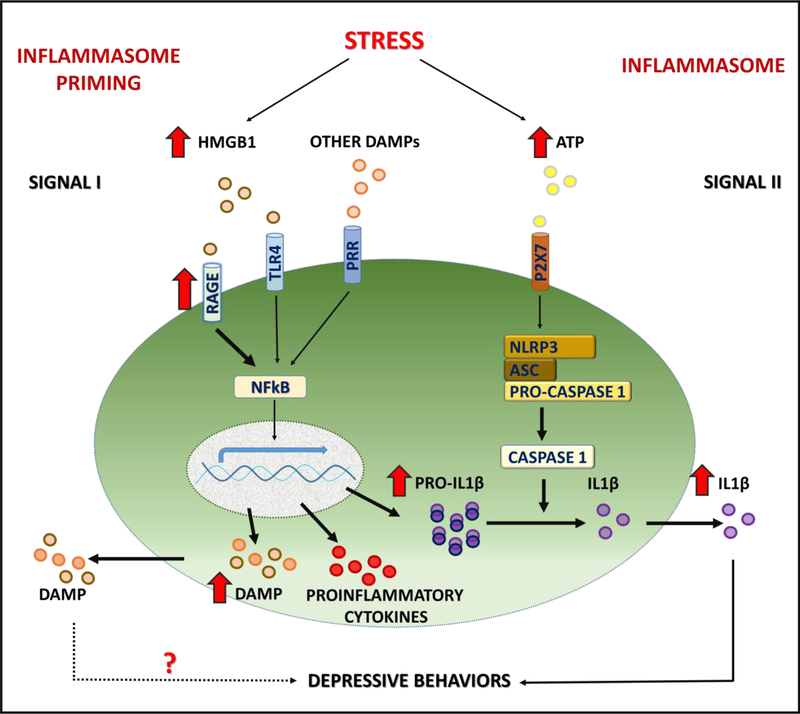
Background: Chronic stress-induced inflammatory responses occur in part via danger-associated molecular pattern (DAMP) molecules, such as high mobility group box 1 protein (HMGB1), but the receptor(s) underlying DAMP signaling have not been identified.

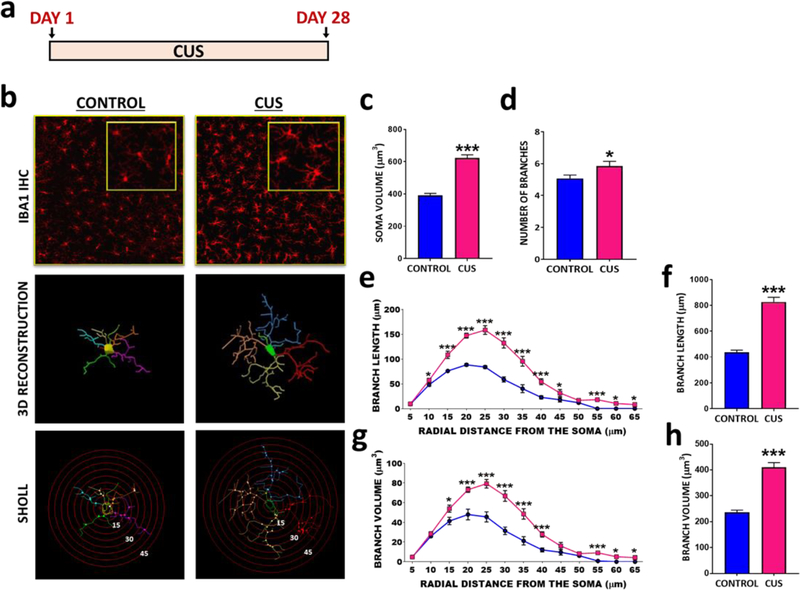
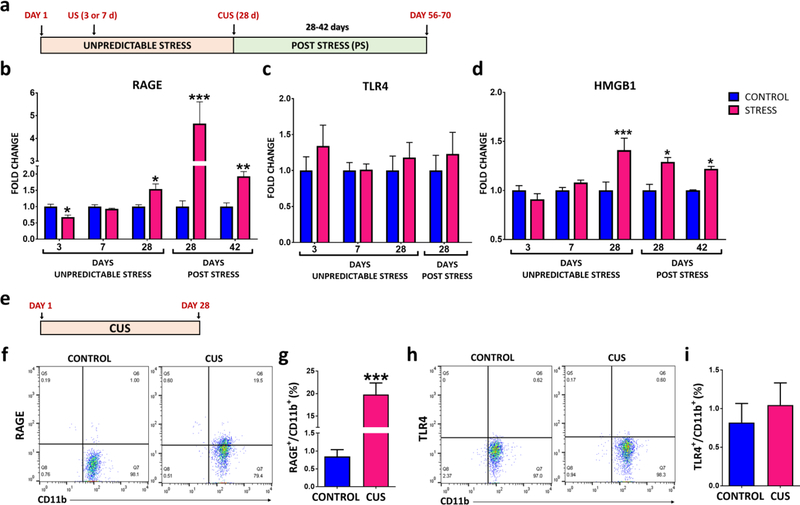
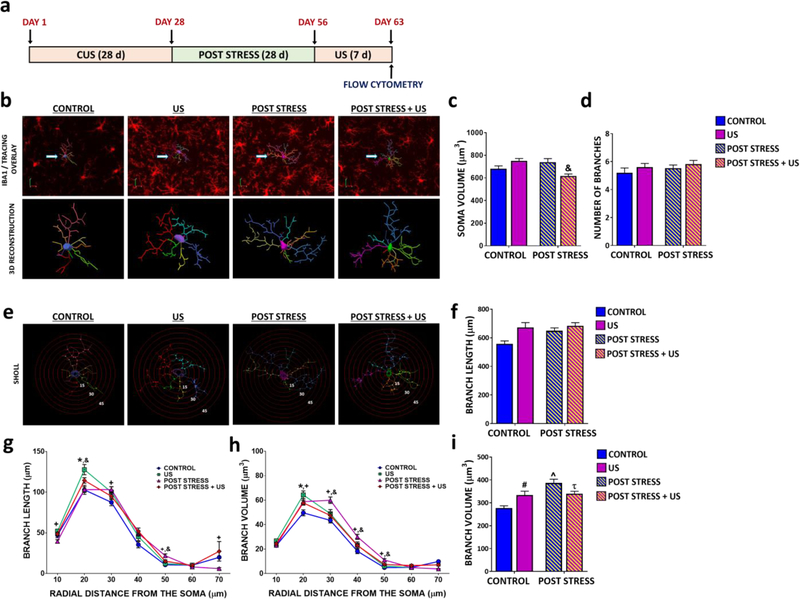
Methods: Microglia morphology and DAMP signaling in enriched rat hippocampal microglia were examined during the development and expression of chronic unpredictable stress (CUS)-induced behavioral deficits, including long-term, persistent changes after CUS.

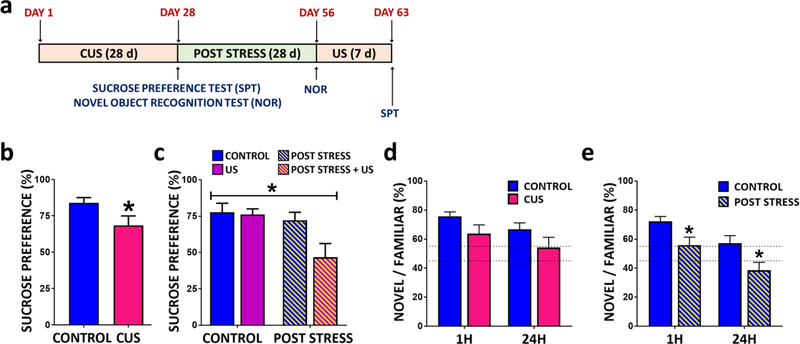
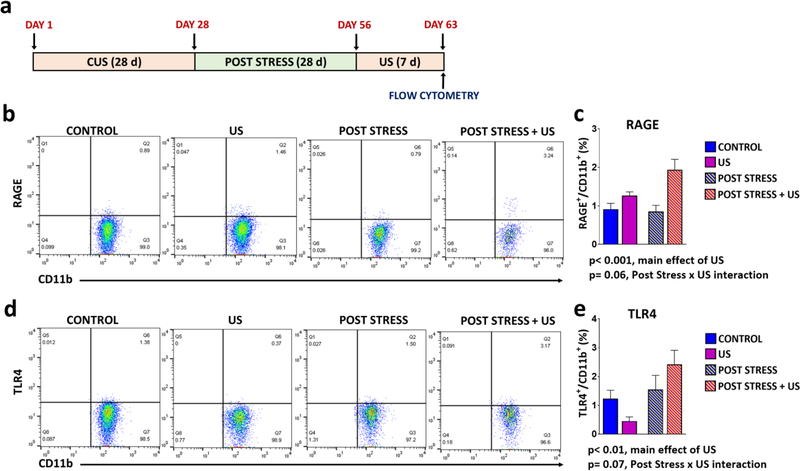
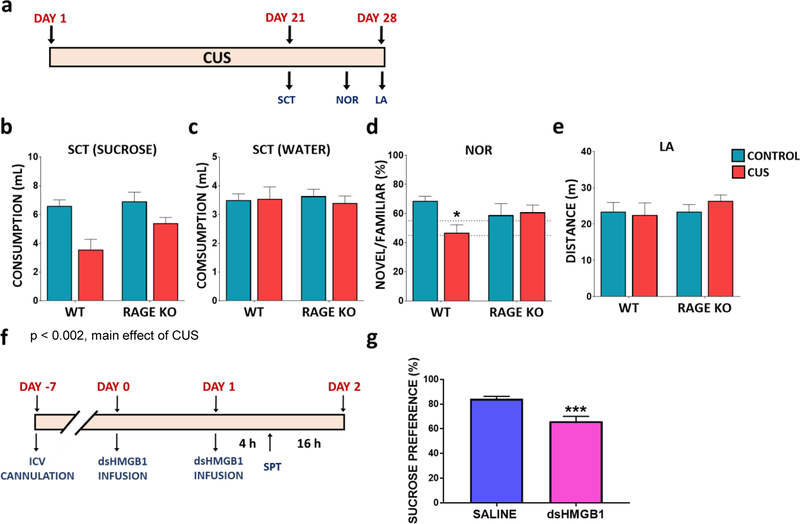
Results: The results show that CUS promotes significant morphological changes and causes robust upregulation of HMGB1 messenger RNA in enriched hippocampal microglia, an effect that persists for up to 6 weeks after CUS exposure. This coincides with robust and persistent upregulation of receptor for advanced glycation end products (RAGE) messenger RNA, but not toll-like receptor 4 in hippocampal microglia. CUS also increased surface expression of RAGE protein on hippocampal microglia as determined by flow cytometry and returned to basal levels 5 weeks after CUS. Importantly, exposure to short-term stress was sufficient to increase RAGE surface expression as well as anhedonic behavior, reflecting a primed state that results from a persistent increase in RAGE messenger RNA expression. Further evidence for DAMP signaling in behavioral responses is provided by evidence that HMGB1 infusion into the hippocampus was sufficient to cause anhedonic behavior and by evidence that RAGE knockout mice were resilient to stress-induced anhedonia.

Conclusions: Together, the results provide evidence of persistent microglial HMGB1-RAGE expression that increases vulnerability to depressive-like behaviors long after chronic stress exposure.

Keywords: Depression; HMGB1; High mobility group box 1 protein; Microglia; RAGE; Receptor for advanced glycation end products; Stress; TLR4; toll-like receptor 4.


Conflict of interest statement

CONFLICT OF INTEREST

The authors declare no conflict of interest.

Figures

Figure 1.
Figure 1.. CUS alters microglial morphology in dorsal hippocampus of rats.
(A) CUS paradigm. (B) Immunohistochemical detection of microglia marker IBA1 within the CA3 pyramidal cell layer, followed by 3D reconstruction and Sholl analysis in Control and CUS rats. Average (C) soma size (t(466)=9.90, p<0.0001), (D) branch number (t(97)=2.18, p=0.0314), (E) total branch volume (t(97)=9.49, p<0.0001) and (G) total branch length (t(97)=10.89, p<0.0001). Sholl analysis for (F) branch length and (H) branch volume in control and CUS animals as a function of distance from soma. The results are expressed as the mean ± SEM., N=4 animals per group, > 60 cells per group. *p<0.05 and ***p<0.001. Student t-test performed for average soma size, branch number and total branch length and volume. Student t-test performed for each distal point of Sholl analysis and significance was determined based on adjusted p values.
Figure 2.
Figure 2.. CUS increases the expression and causes long lasting up-regulation of RAGE in hippocampal microglia.
(A) Experimental paradigm of unpredictable stress (7 or 28 days) exposure and post stress period in rats. Enriched microglia were prepared from hippocampus, mRNA was extracted and levels of each target were determined by PCR analysis. (B) RAGE (Stress Day 28 t(8)=2.639, p=0.0297; Post stress Day 28 t(9)=3.416, p=0.0076; Post stress Day 42 t(8)=4.078, p=0.0046), (C) TLR4 (Stress Day 28 t(10)=0.6207, p=0.5486; Post Stress Day 28 t(8)=0.6281, p=0.5474), and (D) HMGB1 (Stress Day 28 t(8)=2.452, p=0.0397; Post Stress Day 28 t(9)=3.855, p=0.0038; Post stress Day 42 t(7)=6.102, p=0.0004) mRNA expression during stress and post stress. All genes were normalized to housekeeping gene HMBS. (E) Experimental paradigm for flow cytometry analysis. (F-G) RAGE (t(9)=5.505, p=0.0004) and (H-I) TLR4 (t(9)=0.5066, p=0.628) surface expression was quantified by flow cytometry on enriched hippocampal microglia samples collected 4hrs following the last stressor on day 28. Flow cytometry diagrams for (G) RAGE and (I) TLR4. Results are represented as the percentage of RAGE+/CD11b+ or TLR4+/CD11b+ cells out of the total number of cells. The results are expressed as the mean ± SEM., N=4–8 per group. *P<0.05, **P<0.01 and ***P<0.001. Student t-test performed at each time point for mRNA analysis. Student t-test performed for flow cytometry.
Figure 3.
Figure 3.. CUS exposure leads to long lasting vulnerability to anhedonia and cognitive deficits in rats.
(A) Paradigm for CUS plus post stress re-exposure to unpredictable stress. (B) Rats were tested for sucrose preference 4 h following CUS (t(22)=2.08, p=0.0494), or (C) following 4 weeks post stress with or without re-exposure to unpredictable stressors for 7 days (group effect F(3,21)=7.441; p=0.0014). Preference for novel object exploration was tested 1h or 24h after familiar object exposure. Rats were tested for novel object recognition (NOR) (D) 4 hrs (NOR (1h) t(12)=1.551, p=0.1520; NOR (24h) t(22)=1.523, p=0.1419)) or (E) 28 days (NOR (1h) t(12)=2.304, p=0.0399; NOR (24h) t(24)=2.334, p=0.0283) following exposure to the last CUS stressor. The results are expressed as the mean ± SEM. N=10–16 animals per group. *P<0.05. Student t-test was performed for sucrose preference in CUS animals. Two-way ANOVA was performed for post stress sucrose preference test followed by Bonferroni post hoc test. Student t-test performed at each time point for novel object recognition test.
Figure 4.
Figure 4.. CUS induces long lasting morphological effects on hippocampal microglia in rats.
(A) Paradigm for CUS plus post stress re-exposure to unpredictable stress. (B) Immunohistochemical detection of microglia within the CA3 pyramidal cell layer for the microglial marker IBA1, followed by 3D reconstruction in age-matched controls and following US, Post stress and Post stress + US. (C) Average soma size (interaction of stress and prior exposure, F(3,916)=16.06; p<0.0001) and (D) branch number (no effect, F(3,199)=0.0.04141; p<0.8390). (E) Sholl analysis was performed on 3D reconstructed microglia within the CA3 pyramidal cell layer following short term US exposure in naïve and post stress animals. Branch length following (F) 3D analysis (main effect of stress (F(3,199)=4.254; p=0.0404) and prior stress exposure (F(3,199)=9.146; p=0.0028), no interaction) and (G) Sholl analysis (interaction of distance and stress, F(36,2574)=2.943; p<0.0001). Branch volume following (H) 3D analysis (interaction of stress and prior exposure, F(3,199)=12.63; p=0.0005) and (I) Sholl analysis (F(36,2574)=2.597; p<0.0001). The results are expressed as the mean ± SEM., N=4 animals per group, > 60 cells per group. # P≤0.1 US compared to controls. ^P<0.05 Post stress animals compared to controls. τ P<0.05 Post stress + US compared to Post Stress. & P<0.05 Post stress + US compared to Post Stress. Two-way ANOVA was performed followed by Bonferroni post hoc test for average soma size, branch number and total branch length and volume. Two-way ANOVA was performed followed by Bonferroni post hoc test for each distal point of Sholl analysis.
Figure 5.
Figure 5.. Previous CUS exposure increases vulnerability to short-term US-induced up-regulation RAGE and TLR4 in stress recovery rats.
(A) Paradigm for CUS plus post stress re-exposure to unpredictable stress. (B-E) RAGE and TLR4 were quantified by flow cytometry of enriched hippocampal microglia samples collected 4 h following the last US stressor. Flow cytometry diagrams for (C) RAGE (main effect of US, F(1,33)=14.17; p=0.0007; strong trend towards interaction of stress and prior exposure, F(1,33)=3.649; p=0.0648) or (E) TLR4 ((main effect of prior exposure, F(1,35)=6.764; p=0.0135; strong trend for interaction of US and prior exposure, F(1,35)=3.48; p=0.0705). Results are represented as the percentage of TLR4+/CD11b+ or RAGE+/CD11b+ cells out of the total number of cells. The results are expressed as the mean ± SEM. N=8–14 per group. Statistics were calculated by two-way ANOVA followed by Bonferroni post hoc test.
Figure 6.
Figure 6.. RAGE deletion attenuates CUS induced behavioral deficits in mice.
(A) Experimental paradigm. Wild type (WT) and RAGE deletion mutant mice were tested for (B) sucrose consumption (main effect of stress F(1,33)=11.39, p=0.0019; no interaction of stress and genotype) and (C) water consumption (no effect F(1,33)=0.0806, p=0.7783 ). Mice were tested for (D) novel object recognition 24h after familiar object exposure (interaction of stress and genotype F(1,15)=4.853, p=0.0437). (E) Total cage locomotor activity within a 20 min period (no effect F(1,30)=0.1782, p=0.6759). The results are expressed as the mean ± SEM. N=6–10 animals per group. (F) Experimental paradigm for disulfide HMGB1 (dsHMGB1) infusion in naïve C57BL6 mice. (G) Mice were tested for sucrose preference 4 hrs post dsHMGB1 ICV infusion (t(24)=4.399, p=0.0002). The results are expressed as the mean ± SEM. N=12–14 animals per group. *p<0.05 and ***p<0.001. Two-way ANOVA was performed followed by Bonferroni post hoc test for behavioral analysis in RAGE KO mice. Student t-test was performed for sucrose preference test following dsHMGB1 infusion.
Figure 7.
Figure 7.. Schematic of stress-induced inflammasome priming.
Exposure to stress activates DAMP-PRR (e.g., HMGB1-RAGE) and downstream NFκΒ signaling to increase transcription of the proinflammatory cytokine IL1β, as well as further increase the expression of HMGB1. Microglial response to stress also requires activation of P2X7 receptors, for example via release of ATP, and activation of the NLRP3 inflammasome complex, which then stimulates the processing of pro-caspase 1 to caspase 1, which in turn cleaves pro-IL1β to IL1β for release. Exposure to CUS results in long-lasting, persistent elevation of HMGB1 and RAGE mRNA expression, and increases sensitivity to subsequent short-term stress exposure, which increases surface/extracellular levels of microglial RAGE. Elevated HMGB1-RAGE underlies increased vulnerability to depressive behaviors such as anhedonia that is blocked in RAGE deletion mutant mice.

Comment in

References

    1. Kessler RC, Bromet EJ (2013): The epidemiology of depression across cultures. Annu Rev Public Health 34:119–138. - PMC - PubMed
    1. Moylan S, Maes M, Wray NR, Berk M (2013): The neuroprogressive nature of major depressive disorder: pathways to disease evolution and resistance, and therapeutic implications. Mol Psychiatry 18:595–606. - PubMed
    1. Smoller JW (2016): The Genetics of Stress-Related Disorders: PTSD, Depression, and Anxiety Disorders. Neuropsychopharmacology 41:297–319. - PMC - PubMed
    1. Kendler KS, Halberstadt LJ (2013): The road not taken: life experiences in monozygotic twin pairs discordant for major depression. Mol Psychiatry 18:975–984. - PMC - PubMed
    1. Gilman SE, Trinh NH, Smoller JW, Fava M, Murphy JM, Breslau J (2013): Psychosocial stressors and the prognosis of major depression: a test of Axis IV. Psychol Med 43:303–316. - PMC - PubMed

MeSH terms