. 2017 Dec:163:220-230.
doi: 10.1016/j.neuroimage.2017.08.065. Epub 2017 Sep 4.

Spatial gene expression analysis of neuroanatomical differences in mouse models

Affiliations

Spatial gene expression analysis of neuroanatomical differences in mouse models

Darren J Fernandes et al. Neuroimage. 2017 Dec.

Abstract

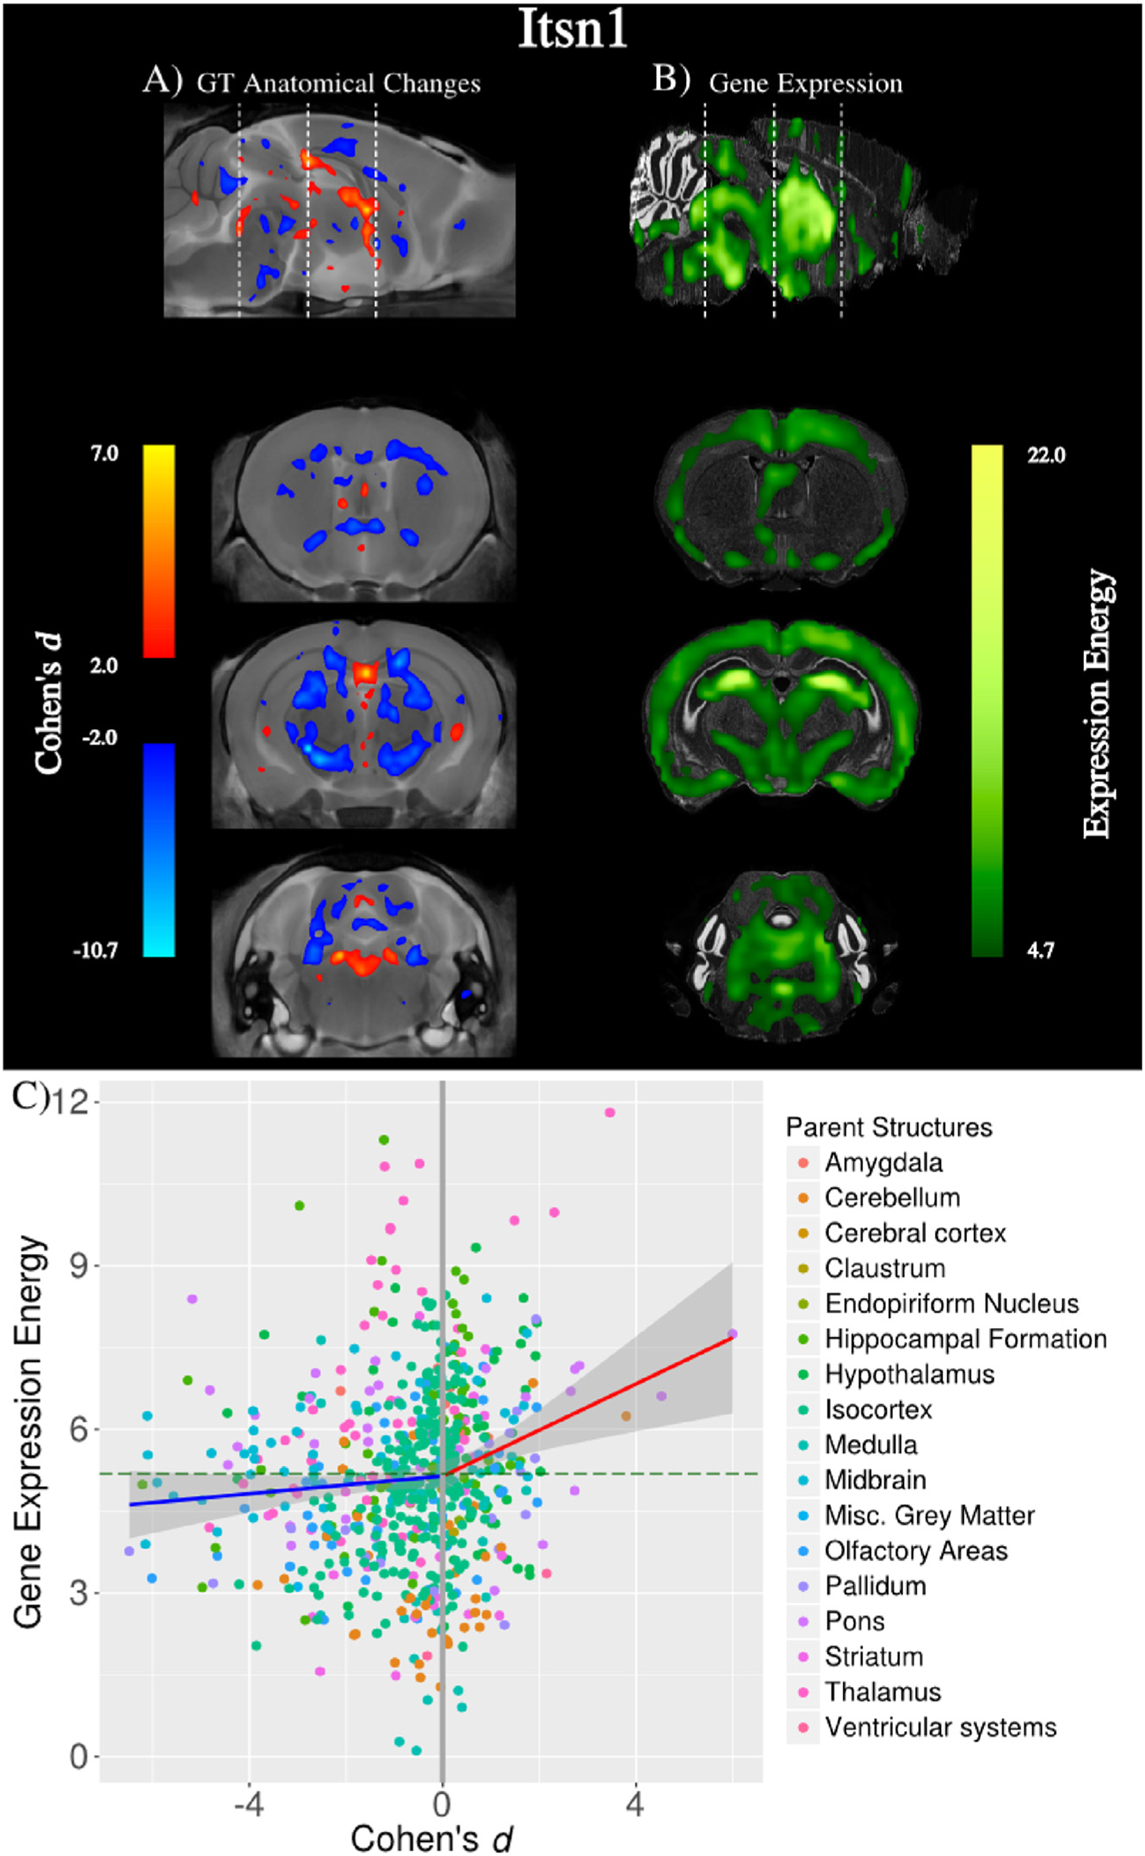
MRI is a powerful modality to detect neuroanatomical differences that result from mutations and treatments. Knowing which genes drive these differences is important in understanding etiology, but candidate genes are often difficult to identify. We tested whether spatial gene expression data from the Allen Brain Institute can be used to inform us about genes that cause neuroanatomical differences. For many single-gene-mutation mouse models, we found that affected neuroanatomy was not strongly associated with the spatial expression of the altered gene and there are specific caveats for each model. However, among models with significant neuroanatomical differences from their wildtype controls, the mutated genes had preferential spatial expression in affected neuroanatomy. In mice exposed to environmental enrichment, candidate genes could be identified by a genome-wide search for genes with preferential spatial expression in the altered neuroanatomical regions. These candidates have functions related to learning and plasticity. We demonstrate that spatial gene expression of single-genes is a poor predictor of altered neuroanatomy, but altered neuroanatomy can identify candidate genes responsible for neuroanatomical phenotypes.


Figures

Fig. 1.
Fig. 1.
The MRI reference atlas was registered to the Allen Reference Atlas. The grid lines show the volumetric changes cause by the non-linear registration and are spaced 500 μm apart in the MRI Reference Space. Registration was sufficiently accurate to study Allen gene expression data, which has an isotropic resolution of 200 μm.
Fig. 2.
Fig. 2.
Preferential spatial expression of mutated genes in affected neuroanatomy of single-gene mutant mouse models. Each point represents a different mouse model. Circular points indicates whether gene is preferentially expressed in altered neuroanatomy (1000 voxels with highest magnitude effect sizes) and triangular points indicate lack of preferential expression. Point colour indicates the probability altered neuroanatomy predicts high gene expression at optimal thresholds (Optimized PPV). Red/Blue colours indicate PPV values over/under arbitrarily selected 0.5. The minimum FDR is plotted on the x-axis; the more significant the altered neuroanatomy, the lower the minimum FDR. Vertical dashed line indicates 10% FDR threshold for significant effects. The maximum gene expression energy is plotted on the y-axis; the greater the ISH signal, the higher the maximum gene expression energy. Horizontal dashed line indicates arbitrary threshold for low gene expression energy. 65% of mouse models have preferential spatial expression of the mutated gene. Furthermore, preferential expression is found in 8 of 9 mouse models with significantly altered neuroanatomy and high gene expression energy.
Fig. 3.
Fig. 3.
A Altered neuroanatomy in En2 KO mice (n = 11) compared to wildtype controls (n = 9), highlighting the top 1000 voxels with the largest Cohen’s |d|. Negative (blue) voxels indicate regions have smaller volumes than controls. B En2 gene expression from the Allen Brain Atlas, with the mean gene expression energy as the threshold. The altered neuroanatomy has a preferential spatial expression of the En2 gene.
Fig. 4.
Fig. 4.
Neuroanatomical changes in mice with A one functioning copy of Nrxn1α (Het; n = 13) and B no functioning copies (KO; n = 9) compared to wildtype controls (n = 10). Neuroanatomical images are thresholded to include top 1000 voxels with highest Cohen’s |d| in Het. Gene expression of C Nrxn1 (Experiment ID: 70301083) and D Nlgn3 (Experiment ID: 70300559), thresholded to their mean expression in the brain. E Sensitivity of structure volume to Nrxn1α dosage versus Nrxn1 expression. Horizontal line is the average expression energy in structures. Regions with high gene expression are more likely to be bigger in mice with less Nrxn1α, as shown by the red line (p-value<8e-4). For example, PVT (E inset) has high Nrxn1 gene expression (mean energy 17.6) and is sensitive to Nrxn1α dosage (t-stat: −4.64). E Structures with high Nlgn3 expression also show similar, but weaker, dosage dependence (p-value = 0.095).
Fig. 5.
Fig. 5.
A Neuroanatomical changes in mice with a Itsn1 gene trap (Itsn1 GT) representing a complete loss-of-function mutant (n = 7) compared to wildtype controls (n = 8). B Gene expression of Itsn1 downloaded from the Allen Brain Institute (Experiment ID: 1365). There are large volume decreases in white matter, which do not have high gene expression. C Plotting the effect size of structure volumes against gene expression reveals volume increases are associated with gene expression (red line; p-value<0.002) but not volume decreases (blue line).
Fig. 6.
Fig. 6.
A Mice raised in enriched environments (n = 14) have larger regions in the hippocampus, motor cortex, and cerebellum compared to mice raised in normal lab cages (n = 14). We found many genes that are preferentially expressed in these regions and a GO enrichment analysis revealed genes are associated with learning. For example: B Nrp1 (fold change 1.36) is highly expressed in the hippocampus and is associated with axon guidance, C Bdnf (fold change 1.22) is expressed throughout the cerebral cortex and is associated with memory, and D Pcp2 (fold change 1.14) is highly expressed in the cerebellum and is associated with cerebellar plasticity.

References

    1. Albertelli MA, O’Mahony OA, Brogley M, Tosoian J, Steinkamp M, Daignault S, Wojno K, Robins DM, 2008. Glutamine tract length of human androgen receptors affects hormone-dependent and-independent prostate cancer in mice. Hum. Mol. Genet 17, 98–110. - PubMed
    1. Amaral DG, Schumann CM, Nordahl CW, 2008. Neuroanatomy of autism. Trends Neurosci. 31, 137–145. - PubMed
    1. Avants BB, Yushkevich P, Pluta J, Minkoff D, Korczykowski M, Detre J, Gee JC, 2010. The optimal template effect in hippocampus studies of diseased populations. Neuroimage 49, 2457–2466. - PMC - PubMed
    1. Bobinski M, de Leon MJ, Convit A, Santi SD, Wegiel J, Tarshish CY, Saint Louis L, Wisniewski HM, 1999. Mri of entorhinal cortex in mild alzheimer’s disease. Lancet 353, 38–40. - PubMed
    1. Bohland JW, Bokil H, Pathak SD, Lee CK, Ng L, Lau C, Kuan C, Hawrylycz M, Mitra PP, 2010. Clustering of spatial gene expression patterns in the mouse brain and comparison with classical neuroanatomy. Methods 50, 105–112. - PubMed

Publication types

LinkOut - more resources