. 2018 Jan;32(1):289-303.
doi: 10.1096/fj.201700252RR. Epub 2017 Sep 7.

FFAR2-FFAR3 receptor heteromerization modulates short-chain fatty acid sensing

Affiliations

FFAR2-FFAR3 receptor heteromerization modulates short-chain fatty acid sensing

Zhiwei Ang et al. FASEB J. 2018 Jan.

Abstract

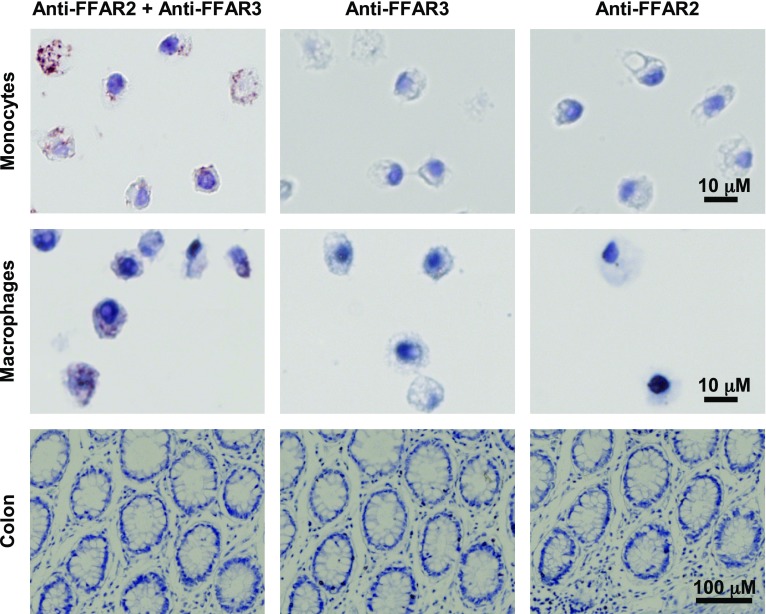
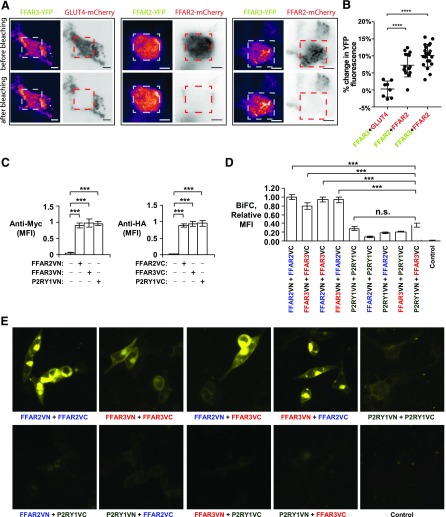
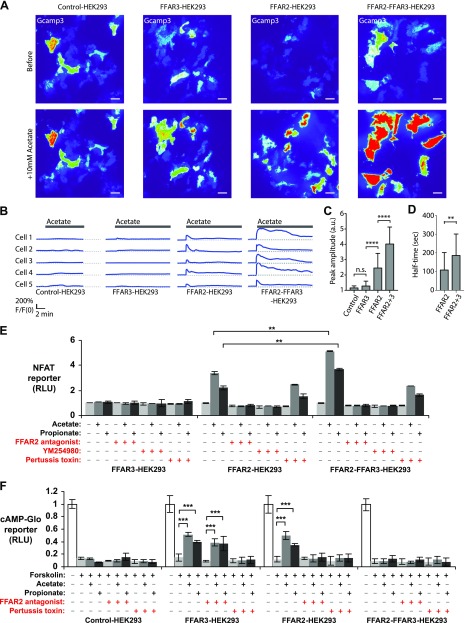
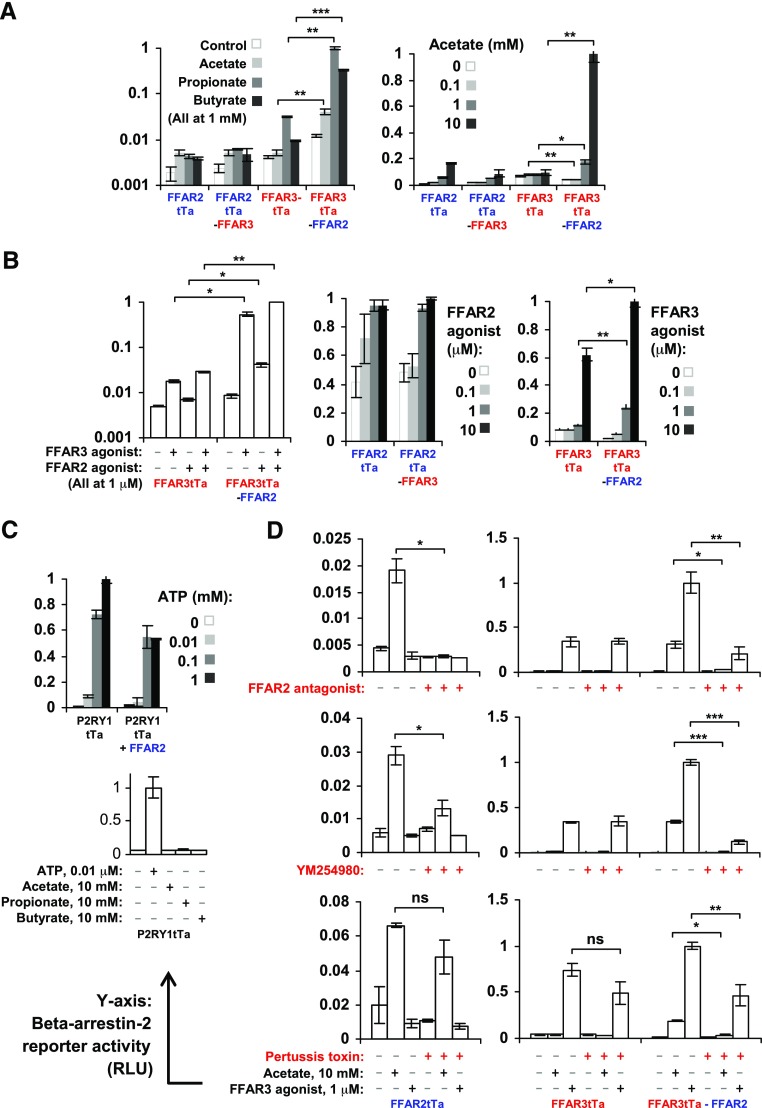
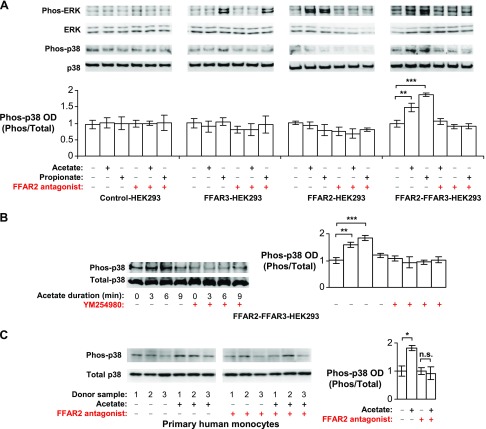
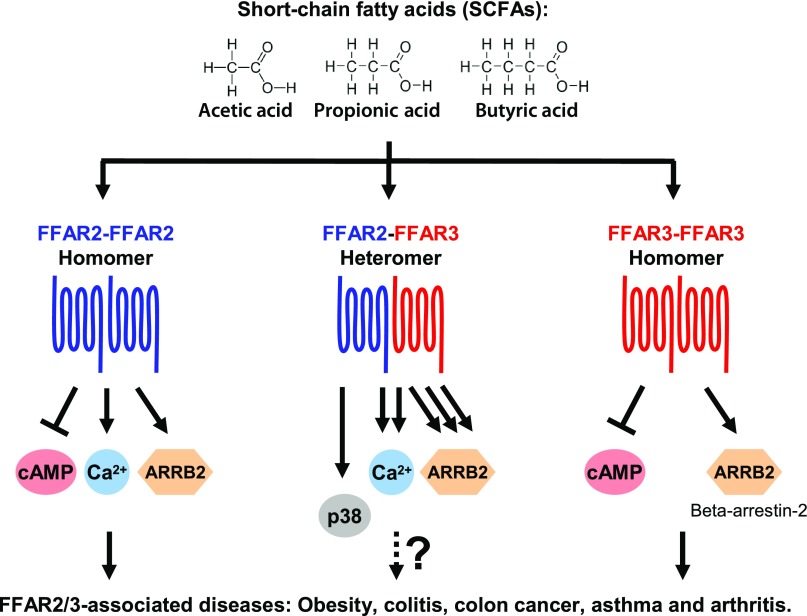
Free fatty acid receptors 2 and 3 (FFAR2/FFA2/GPR43 and FFAR3/FFA3/GPR41) are mammalian receptors for gut microbiota-derived short-chain fatty acids (SCFAs). These receptors are promising drug targets for obesity, colitis, colon cancer, asthma, and arthritis. Here, we demonstrate that FFAR2 and FFAR3 interact to form a heteromer in primary human monocytes and macrophages via proximity ligation assay, and during heterologous expression in HEK293 cells via bimolecular fluorescence complementation and fluorescence resonance energy transfer. The FFAR2-FFAR3 heteromer displayed enhanced cytosolic Ca2+ signaling (1.5-fold increase relative to homomeric FFAR2) and β-arrestin-2 recruitment (30-fold increase relative to homomeric FFAR3). The enhanced heteromer signaling was attenuated by FFAR2 antagonism (CATPB), Gαq inhibition (YM254890), or Gαi inhibition (pertussis toxin). Unlike homomeric FFAR2/3, the heteromer lacked the ability to inhibit cAMP production but gained the ability to induce p38 phosphorylation in HEK293 and inflammatory monocytes via a CATPB- and YM254890-sensitive mechanism. Our data, taken together, reveal that FFAR2 and FFAR3 may interact to form a receptor heteromer with signaling that is distinct from the parent homomers-a novel pathway for drug targeting.-Ang, Z., Xiong, D., Wu, M., Ding, J. L. FFAR2-FFAR3 receptor heteromerization modulates short-chain fatty acid sensing.

Keywords: FFA2/GPR43; FFA3/GPR41; GPCR heteromer.


Figures

Figure 1.
Figure 1.
FFAR2-FFAR3 heteromer is expressed in human monocytes and macrophages. In situ PLA of human paraffin-embedded tissue sections of peripheral blood monocytes, macrophages, and colon epithelial cells. Red and brown spots indicate positive PLA signals when anti-FFAR2 and anti-FFAR3 PLA probe pairs are in proximity. Samples probed without one of the primary antibodies act as negative controls. All samples were probed in parallel. Data shown are representative of 3 independent experiments.
Figure 2.
Figure 2.
BiFC and FRET assays detect heteromer and homomer formation during coexpression of FFAR2 and FFAR3 in HEK293 cells. A, B) YFP-tagged FFAR2/FFAR3 were coexpressed with mCherry-tagged FFAR2/GLUT4 in HEK293 cells. A) Representative TIRF microscopy images are shown, with fluorescence intensity detected by YFP and mCherry channels displayed in pseudocolor and monochrome, respectively. Images were captured before and after photobleaching of mCherry in a 60- × 60-pixel region of interest, as denoted by red dashed squares, with before and after images captured 2 s apart. Scale bars, 5 μm. B) These before and after photobleaching images (YFP channel) were used to calculate percentage change in YFP fluorescence. For FFAR3YFP-GLUT4mCherry, n = 8 cells were from 2 experiments; for FFAR2YFP-FFAR2mCherry, n = 15 cells were from 3 experiments; for FFAR3YFP-FFAR2mCherry, n = 22 cells were from 3 experiments. Error bar indicates sd. ****P < 0.0001, Student’s t test. C–E) FFAR2, FFAR3, and P2RY1 were tagged at N terminus with myc or HA epitopes, and at C terminus with VN or VC pBiFC fragments, respectively. These constructs were transiently expressed in HEK293, and their expression levels were determined via immunostaining of myc/HA tags followed by flow cytometry analysis (C). Upon coexpression of these constructs, interaction of receptors would allow for VN and VC fragments to reconstitute full Venus fluorescent protein. Resulting gain in fluorescence signal was measured in live cells via flow cytometry (D) and fluorescence microscopy (E). Flow cytometry readings are expressed as median fluorescence intensity (MFI) of 20,000 cells. Values shown are means ± sd of triplicate transfections. FFAR2VN-FFAR2VC sample has been arbitrarily assigned value of 1. Two-tailed Welch’s t test was used to determine statistical significance. P < 0.05, **P < 0.01, ***P < 0.001.
Figure 3.
Figure 3.
FFAR2-FFAR3 heteromerization enhances Ca2+ signaling via pertussis toxin–sensitive mechanism while attenuating cAMP inhibition. Assays were performed on HEK293 cells that stably express FFAR3, FFAR2, or both (control-, FFAR3-, FFAR2- and FFAR2-FFAR3-HEK293). AD) Cytosolic Ca2+ levels upon 10 mM acetate stimulation as measured via GCaMP3 Ca2+ reporter. Reporter fluorescence is proportional to Ca2+ concentration and was quantified via TIRF microscopy. A) GCaMP3 fluorescence represented with pseudocolor lookup table before and during peak response after acetate stimulation. B) Representative time series of GCaMP3 fluorescence intensity upon acetate stimulation. C, D) Quantification of GCaMP3 fluorescence peak amplitude (F/F0) (C) and fluorescence half-times (D). F, fluorescence intensity after stimulation. F0, intensity before stimulation. For control-HEK293, n = 21 cells from 2 experiments; for FFAR3-HEK293, n = 30 cells from 2 experiments; for FFAR2-HEK293, n = 33 cells from 3 experiments, and for FFAR2-FFAR3-HEK293, n = 31 cells from 3 experiments. A.u., arbitrary units; n.s., nonsignificant. Scale bars for fluorescence images, 10 μm; for time-series profiles, 2 min (horizontal). E) NFAT luciferase reporter assay activity upon overnight induction with 10 mM acetate or 10 mM propionate. Reporter activity is proportional to Ca2+ concentration. Values shown are averages ± sd of triplicate treatment groups (n = 3). All values have been standardized to untreated control, which was arbitrarily set to 1. F) Effect of acetate/propionate treatments on induction of cAMP by 5 μM forskolin. Luminescence signal from cAMP GloMax kit (Promega) is inversely proportional to cAMP concentration. Values shown are averages ± sd of replicate treatment groups (n = 5). All values are relative to untreated control, which was set to 1. Two-tailed Welch’s t test was used to determine statistical significance. *P < 0.05, **P < 0.01, ***P < 0.001, ****P < 0.0001.
Figure 4.
Figure 4.
FFAR2-FFAR3 heteromerization enhances β-arrestin-2 recruitment to FFAR3 subunit via mechanism sensitive to FFAR2 antagonism, Gαi inhibition, and pertussis toxin. β-Arrestin-2 recruitment rates to FFAR2/3tTa (FFAR2/3 receptors with C-terminal tTa fusions) upon overnight induction with acetate, propionate, butyrate, and FFAR2/3 agonist. Reporter activity is proportional to β-arrestin-2 recruitment rates. Cells expressed either homomeric FFAR2tTa, homomeric FFAR3tTa, heteromeric FFAR2tTa-FFAR3, or heteromeric FFAR3tTa-FFAR2. A) β-Arrestin-2 reporter activity during SCFA agonist (acetate, propionate, and butyrate) stimulation. B) β-arrestin-2 reporter activity during receptor specific agonist stimulation. C) β-Arrestin-2 reporter activity during coexpression of FFAR2 with noninteracting receptor P2YR1tTa upon overnight induction with ATP at indicated concentration. D) β-Arrestin-2 recruitment during FFAR2 antagonism (CATPB), Gαq inhibition (YM254890), and Gαi inhibition (pertussis toxin). Data shown are means of triplicate treatment groups (n = 3) ± sd and are representative of 3 independent experiments. Highest reading has been arbitrarily assigned value of 1. Two-tailed Welch’s t test was used to determine statistical significance. *P < 0.05, **P < 0.01, ***P < 0.001.
Figure 5.
Figure 5.
FFAR2-FFAR3 heteromerization enables p38 phosphorylation in HEK293 and monocytes. This effect was abolished by FFAR2 antagonism and Gαq inhibition. A, B) HEK293 cell lines that stably express FFAR3, FFAR2, or both (i.e., control-, FFAR3-, FFAR2- and FFAR2-FFAR3-HEK293) were stimulated with 10 mM acetate or 10 mM propionate for 6 min (A) or indicated times (B). Western blots are representative of 3 independent experiments. Optical density (OD) measurements of 3 independent experiments are shown (means ± sd). C) Monocytes were stimulated with 10 mM acetate for 3 min. Western blot displays samples from 3 different donors. Corresponding OD is shown as means ± sd; n = 3. Vehicle control has been arbitrarily assigned value of 1. Two-tailed Welch’s t test was used to determine statistical significance. *P < 0.05, **P < 0.01, ***P < 0.001.
Figure 6.
Figure 6.
FFAR2-FFAR3 heteromer displays signaling that is distinct from parent homomers. Heteromer displays enhanced intracellular Ca2+ signaling (1.5-fold increase relative to homomeric FFAR2) and β-arrestin-2 recruitment (30-fold increase relative to homomeric FFAR3) while losing ability to inhibit cAMP production. These heteromer-mediated enhancements were attenuated by FFAR2 antagonism (CATPB), Gαq inhibition (YM254890), or Gαi inhibition (pertussis toxin). Heteromerization also enabled p38 phosphorylation via CATPB- and YM254890-sensitive mechanism.

References

    1. Brown A. J., Goldsworthy S. M., Barnes A. A., Eilert M. M., Tcheang L., Daniels D., Muir A. I., Wigglesworth M. J., Kinghorn I., Fraser N. J., Pike N. B., Strum J. C., Steplewski K. M., Murdock P. R., Holder J. C., Marshall F. H., Szekeres P. G., Wilson S., Ignar D. M., Foord S. M., Wise A., Dowell S. J. (2003) The Orphan G protein–coupled receptors GPR41 and GPR43 are activated by propionate and other short chain carboxylic acids. J. Biol. Chem. 278, 11312–11319 - PubMed
    1. Le Poul E., Loison C., Struyf S., Springael J.-Y., Lannoy V., Decobecq M.-E., Brezillon S., Dupriez V., Vassart G., Van Damme J., Parmentier M., Detheux M. (2003) Functional characterization of human receptors for short chain fatty acids and their role in polymorphonuclear cell activation. J. Biol. Chem. 278, 25481–25489 - PubMed
    1. Tang C., Ahmed K., Gille A., Lu S., Gröne H.-J., Tunaru S., Offermanns S. (2015) Loss of FFA2 and FFA3 increases insulin secretion and improves glucose tolerance in type 2 diabetes. Nat. Med. 21, 173–177 - PubMed
    1. Ge H., Li X., Weiszmann J., Wang P., Baribault H., Chen J.-L., Tian H., Li Y. (2008) Activation of G protein–coupled receptor 43 in adipocytes leads to inhibition of lipolysis and suppression of plasma free fatty acids. Endocrinology 149, 4519–4526 - PubMed
    1. Bjursell M., Admyre T., Göransson M., Marley A. E., Smith D. M., Oscarsson J., Bohlooly-Y M. (2011) Improved glucose control and reduced body fat mass in free fatty acid receptor 2–deficient mice fed a high-fat diet. Am. J. Physiol. Endocrinol. Metab. 300, E211–E220 - PubMed

Publication types

MeSH terms