. 2017 Sep 8;357(6355):1033-1036.
doi: 10.1126/science.aan3846.

Behavioral time scale synaptic plasticity underlies CA1 place fields

Affiliations

Behavioral time scale synaptic plasticity underlies CA1 place fields

Katie C Bittner et al. Science. .

Abstract

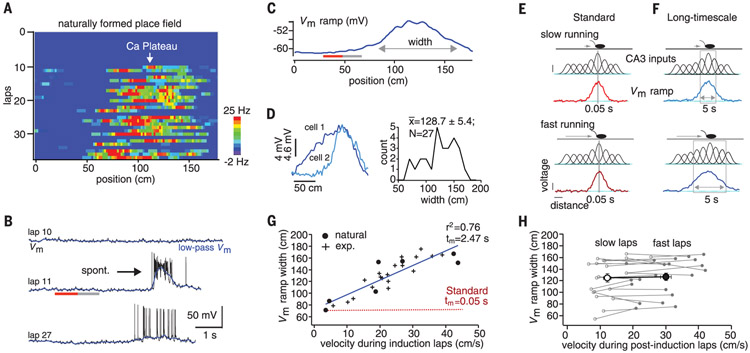
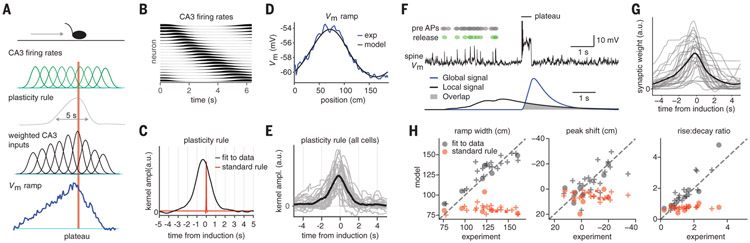
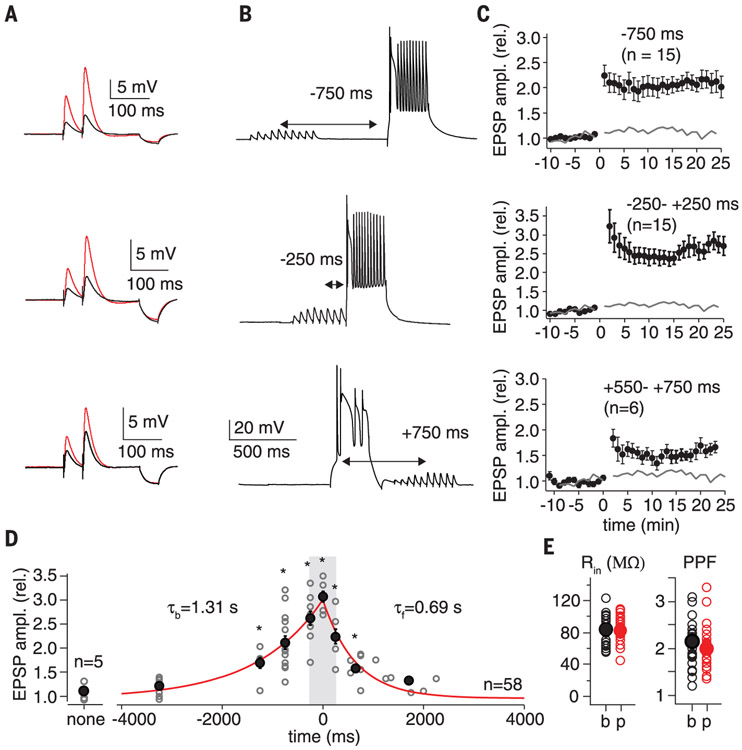
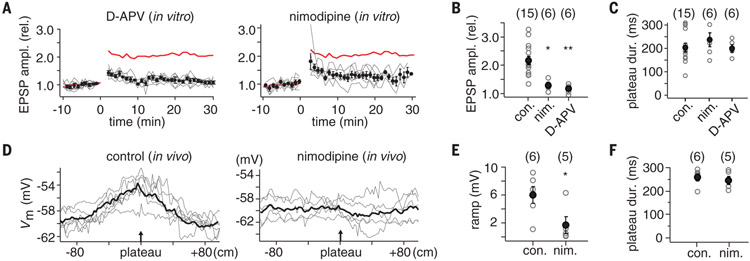
Learning is primarily mediated by activity-dependent modifications of synaptic strength within neuronal circuits. We discovered that place fields in hippocampal area CA1 are produced by a synaptic potentiation notably different from Hebbian plasticity. Place fields could be produced in vivo in a single trial by potentiation of input that arrived seconds before and after complex spiking. The potentiated synaptic input was not initially coincident with action potentials or depolarization. This rule, named behavioral time scale synaptic plasticity, abruptly modifies inputs that were neither causal nor close in time to postsynaptic activation. In slices, five pairings of subthreshold presynaptic activity and calcium (Ca2+) plateau potentials produced a large potentiation with an asymmetric seconds-long time course. This plasticity efficiently stores entire behavioral sequences within synaptic weights to produce predictive place cell activity.


Figures

Fig. 1.
Fig. 1.. Place-field properties suggest seconds-long plasticity rule.
(A) Spatial firing rates; (B) Vm (black) and low-pass filtered Vm (blue) for laps preceding (lap 10), during (lap 11), and after plateau (lap 14); and (C) average Vm ramp. Gray and red lines indicate the first 20 cm and preceding 20 cm of the Vm ramp, respectively. (D) Left, Vm ramps from two additional neurons (cells 1 and 2). Right, distribution of Vm ramp width for all recorded neurons. (E) Mouse on linear track for low (top)– and high (bottom)–velocity cases. Gaussian functions represent tuned input from CA3 neurons, where height indicates weight. Resulting Vm ramp for millisecond plasticity time window (gray box) is shown. (F) Same as in (E) except plasticity window covers seconds, allowing Vm ramp to vary as a function of running speed. (G) Vm ramp width versus average running velocity during induction trials. Data points fit by linear equation (blue line). Red dashed line is linear relationship expected for standard rule. exp., experimentally induced. (H) Vm ramp width versus average running velocity for laps after place-field induction. Slow laps (open symbols) and fast laps (closed symbols) for each neuron. Large open and closed circles are population means.
Fig. 2.
Fig. 2.. Asymmetric synaptic plasticity rule spans for seconds around plateau potential.
(A) Mouse on linear track (top), Gaussian functions representing place-field firing in the CA3 neurons (green), the to-be-determined plasticity rule that controls the synaptic weights of CA3 inputs (gray), Gaussian functions representing CA3 excitatory input weighted by above rule (black), and the resulting Vm ramp in CA1 neuron (blue). Red bar indicates plateau potential. (B) Activity of CA3 population versus time during induction trial. (C) Synaptic weight values as a function of time from plateau (plasticity rule) inferred from the data (black) and 50-fold time-compressed rule (red) for comparison. ampl., amplitude; a.u., arbitrary units. (D) Measured Vm ramp (blue) compared with computed Vm ramp (black). (E) Inferred synaptic plasticity rule for all CA1 place cells. Black trace is mean. (F) Simulation of a CA1 pyramidal cell. Complex spike at track center induces plasticity. Top, CA3 place cell spiking (black dots), resulting glutamate release (green dots), and associated Vm in single CA1 spine (black trace). Bottom, calculated local spine signal (blue) and global dendritic signal (black). Overlap determines the synaptic-weight increment (gray). (G) CA3 synaptic input weight plotted relative to plateau initiation (gray, individual neurons; black, mean). (H) Vm ramps generated by signals reproduce the experimental data (gray), whereas the version that uses shorter signals does not (red). Naturally occurring (plusses) and experimentally induced plateaus (circles).
Fig. 3.
Fig. 3.. Behavioral time scale synaptic plasticity.
(A) EPSPs used to determine synaptic strength (50-ms interval). Black trace is average baseline EPSP; red trace is average postpairing EPSP. Hyperpolarization following EPSPs from 50 ms, −25-pA current injection used to determine input resistance (Rin). (B) Vm trace showing representative induction protocol with 10 synaptic stimuli (20 Hz) followed by plateau potential (300-ms current injection). (C) Average EPSP amplitude (normalized to baseline; ±SEM) for population of neurons that received the indicated induction protocol. Induction (five pairings) at 0 min. Gray line is average EPSP amplitude for synaptic stimulation alone. (D) Plot of postinduction EPSP amplitude normalized to baseline versus the induction interval time for the entire population of neurons. Open gray symbols are individual neurons; black symbols are means. τb (tau backward) from exponential fit of data ranging from 0 to −3250 ms (red line projecting to negative times). τf (tau forward) from exponential fit of data ranging from 0 to +2000 ms (red line projecting to positive times). Synaptic stimulation alone (no pairing interval, labeled none) not included in exponential fits. See supplementary methods for means and P values. rel., relative. (E) Rin and paired-pulse facilitation (PPF) for baseline (b) and postinduction periods (p).
Fig. 4.
Fig. 4.. Pharmacology of BTSP and place-field formation.
(A) Effect of 20 μM d-APV (left) and 10 μM nimodipine (right). Average EPSP amplitude (normalized to baseline; ±SEM) for population of neurons that received −750-ms interval induction protocol. Red line is mean for control [from (C)]. Gray lines are individual neurons. (B) Plot of EPSP amplitude (20 min postpairing/baseline) for control (con.), nimodipine (nim.), and d-APV conditions. *P = 0.0011; **P = 0.00033. Number of cells in each group shown in parentheses. (C) Plot of average plateau-potential duration during the induction protocol for control, nimodipine, and d-APV conditions. No statistical differences were observed. (D) Vm ramp from individual neurons (gray traces) and the population average for control (left; pressure application of external solution containing vehicle) and for drug conditions (right; external solution containing 5 μM nimodipine). (E) Plot of Vm ramp amplitude induced for control and nimodipine conditions. *P = 0.042. (F) Plot of average plateau-potential duration during the induction protocol for control and nimodipine conditions. No statistical differences were observed.

Comment in

  • Wire together, fire apart.
    Krupic J. Krupic J. Science. 2017 Sep 8;357(6355):974-975. doi: 10.1126/science.aao4159. Science. 2017. PMID: 28883061 No abstract available.
  • The Many Worlds of Plasticity Rules.
    Schiller J, Berlin S, Derdikman D. Schiller J, et al. Trends Neurosci. 2018 Mar;41(3):124-127. doi: 10.1016/j.tins.2018.01.006. Epub 2018 Feb 1. Trends Neurosci. 2018. PMID: 29397991

References

    1. Hebb DO, The Organization of Behavior (Wiley, 1949). - PubMed
    1. Sutton RS, Barto AG, Psychol. Rev. 88, 135–170 (1981). - PubMed
    1. Dayan P, Abbott L, Theoretical Neuroscience (MIT Press, 2001).
    1. Mayford M, Siegelbaum SA, Kandel ER, Cold Spring Harb. Perspect. Biol. 4, a005751 (2012). - PMC - PubMed
    1. Feldman DE, Neuron 75, 556–571 (2012). - PMC - PubMed

Publication types

LinkOut - more resources