Clinical Trial
. 2017 Dec;102(12):2058-2068.
doi: 10.3324/haematol.2017.169029. Epub 2017 Sep 7.

Phenotype in combination with genotype improves outcome prediction in acute myeloid leukemia: a report from Children's Oncology Group protocol AAML0531

Affiliations
Clinical Trial

Phenotype in combination with genotype improves outcome prediction in acute myeloid leukemia: a report from Children's Oncology Group protocol AAML0531

Andrew P Voigt et al. Haematologica. 2017 Dec.

Abstract

Diagnostic biomarkers can be used to determine relapse risk in acute myeloid leukemia, and certain genetic aberrancies have prognostic relevance. A diagnostic immunophenotypic expression profile, which quantifies the amounts of distinct gene products, not just their presence or absence, was established in order to improve outcome prediction for patients with acute myeloid leukemia. The immunophenotypic expression profile, which defines each patient's leukemia as a location in 15-dimensional space, was generated for 769 patients enrolled in the Children's Oncology Group AAML0531 protocol. Unsupervised hierarchical clustering grouped patients with similar immunophenotypic expression profiles into eleven patient cohorts, demonstrating high associations among phenotype, genotype, morphology, and outcome. Of 95 patients with inv(16), 79% segregated in Cluster A. Of 109 patients with t(8;21), 92% segregated in Clusters A and B. Of 152 patients with 11q23 alterations, 78% segregated in Clusters D, E, F, G, or H. For both inv(16) and 11q23 abnormalities, differential phenotypic expression identified patient groups with different survival characteristics (P<0.05). Clinical outcome analysis revealed that Cluster B (predominantly t(8;21)) was associated with favorable outcome (P<0.001) and Clusters E, G, H, and K were associated with adverse outcomes (P<0.05). Multivariable regression analysis revealed that Clusters E, G, H, and K were independently associated with worse survival (P range <0.001 to 0.008). The Children's Oncology Group AAML0531 trial: clinicaltrials.gov Identifier: 00372593.

Trial registration: ClinicalTrials.gov NCT00372593.


Figures

Figure 1.
Figure 1.
Overview of immunophenotypic expression profiling (IEP). (A) Diagnostic bone marrow specimens were acquired from each patient enrolled in the COG protocol AAML0531. (B) Then, 200 μL of bone marrow was added to 6 tubes containing (C) Fluorescein Isothiocyanate (FITC)-, Phycoerythrin (PE)-, Peridinin Chlorophyll Protein Complex (PerCP)-, and anti-Allophycocyanin (APC)-conjugated antibodies. (D) Flow cytometry was performed on samples in each tube, and fluorescence measurements, forward light scatter (FSC) and right-angle light scatter (SSC) characteristics were collected for 200,000 events. (E) Flow cytometry results were analyzed by an expert, and leukemic populations were identified by CD45 vs. SSC gating. (F) For cells identified in the leukemia gate, the mean intensity for each parameter (black dot) was computed. Mean fluorescence intensity was utilized as an unaltered quantification of signal. In addition, the coefficient of variation (CV) of CD34 was computed as a metric to assess cellular maturation. (G) Collectively, these 15 quantitative intensities constituted the IEP for each patient.
Figure 2.
Figure 2.
Hierarchical clustering of IEPs. (A) A dendrogram was generated by unsupervised hierarchical clustering of the 769 IEPs. Eleven phenotypic clusters (A–K), selected by minimizing within-cluster variation and maximizing between-cluster variation, were identified for outcome analysis. (B) The IEP of each patient is presented in the form of a heatmap. (C) The morphologic, karyotypic, and mutational profiles of each patient were compared to the IEPs. (D) Genotypic (sub)clusters with associations among IEPs and morphologic, karyotypic, and/or mutational abnormalities were identified for further analysis. (E) Key denoting intensity of the surface gene product expression to color scale and mutational and morphologic classifications. Somatic mutations are denoted in red and those for wild-type patients are denoted in gray. FAB classifications are indicated by color.
Figure 3.
Figure 3.
Kaplan–Meier analysis of 5-year EFS of patients by phenotypic cluster. (A) Curves showing differences in EFS for patients in the 11 IEP clusters. (B) Curves showing phenotypic clusters in which the 5-year EFS for patients was significantly different (P<0.05) from that of patients in other clusters. Although patients in Clusters E and F had identical EFS, Cluster F EFS was not statistically significant due to low sample size.
Figure 4.
Figure 4.
Kaplan–Meier analysis of the differences in 5-year EFS among patients with identical phenotypes in different genotypic subclusters. (A) Patients with inv(16) in Subcluster A-v (green) had a significantly better 5-year EFS than those with inv(16) in Subcluster A-ii (light purple) (P=0.039). (B) Patients with 11q23 in Subclusters D-i, E-i, F-i, G-I, and H-i had heterogeneous 5-year EFS.
Figure 5.
Figure 5.
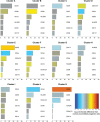
Relative influence of IEP components in each cluster. A boosted decision tree model was trained to identify patients in each cluster versus all other patients. Variable importance was computed by calculating the mean decrease in the Gini index relative to the maximum decrease in the Gini index. The relative influence of the six most important IEP components were plotted for each cluster. In addition, the relative influence of each IEP component is colored in comparison to the intensity of the gene product expression on normal, uncommitted progenitor cells for pediatric patients. For example, a blue-colored bar indicates that the average intensity of a surface gene product within a cluster is lower than the average intensity of that same surface gene product in normal pediatric patients. The combination of most influential IEP components provides insight regarding the multidimensional pattern of surface gene products that are expressed within each cluster. Of note, surface gene products need not be aberrantly expressed to have a high relative influence.

References

    1. Vardiman JW, Thiele J, Arber DA, et al. The 2008 revision of the World Health Organization (WHO) classification of myeloid neoplasms and acute leukemia: rationale and important changes. Blood. 2009;114(5):937–951. - PubMed
    1. Clinical and Laboratory Standards Institute. Clinical flow cytometric analysis of neoplas tic hematolymphoid cells; approved guideline—Second edition. Wayne, PA: US Food and Drug Administration; 2008. FDA publication no. 7-150.
    1. Loken MR, Voigt AP, Eidenschink Brodersen L, et al. Consistent gene product expression #2: antigen intensities on bone marrow cells are invariant between individuals. Cytometry A. 2016;89(11):987–996. - PMC - PubMed
    1. Loken MR, Voigt AP, Eidenschink Brodersen L, Fritschle W, Menssen AJ, Wells DA. Consistent quantitative gene product expression: #3. Invariance with age. Cytometry A. 2016;89(11):997–1000. - PMC - PubMed
    1. Loken MR. Residual disease in AML, a target that can move in more than one direction [editorial]. Cytometry B. 2014; 86(1):15–17. - PubMed

Publication types

Associated data